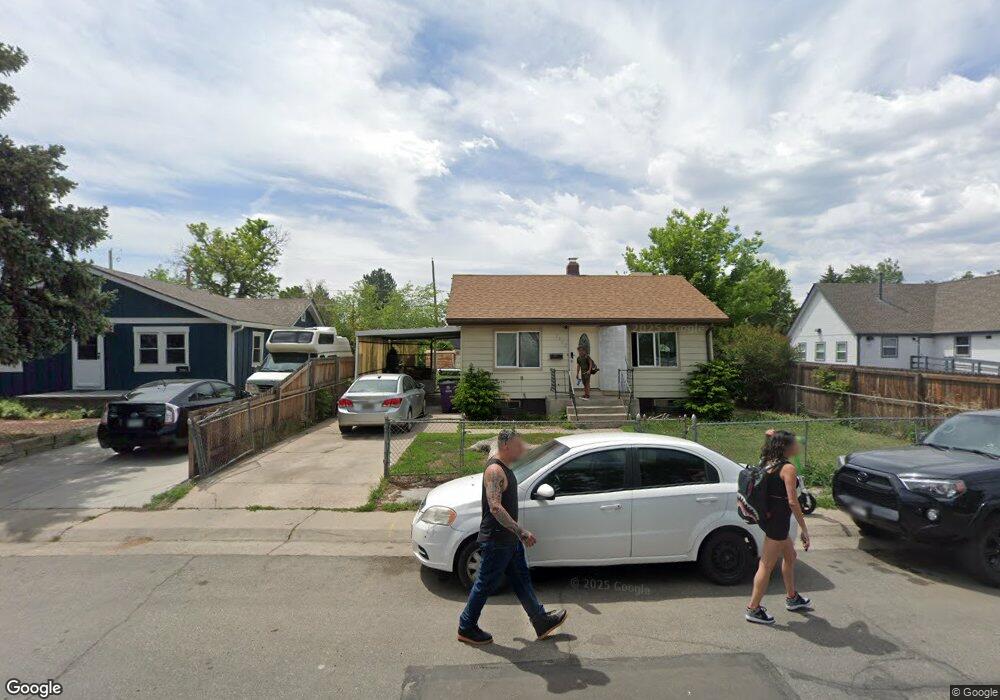
3402 W Walsh Place Denver, CO 80219
Westwood NeighborhoodEstimated Value: $382,000 - $415,000
3
Beds
1
Bath
1,209
Sq Ft
$329/Sq Ft
Est. Value
About This Home
This home is located at 3402 W Walsh Place, Denver, CO 80219 and is currently estimated at $398,055, approximately $329 per square foot. 3402 W Walsh Place is a home located in Denver County with nearby schools including Goldrick Elementary School, Kepner Beacon Middle School, and West High School.
Ownership History
Date
Name
Owned For
Owner Type
Purchase Details
Closed on
Jun 19, 2021
Sold by
Nguyen Tram Ngoc
Bought by
Nguyen Tram Ngoc
Current Estimated Value
Purchase Details
Closed on
Aug 25, 2018
Sold by
Powell Steven D and Powell Cindy A
Bought by
Mcclure Philip L and Mares Joleen
Purchase Details
Closed on
May 25, 2018
Sold by
Nguyen Lap G
Bought by
Nguyen Thoa Ngoc
Purchase Details
Closed on
Oct 31, 2014
Sold by
Nguyen Lap C
Bought by
Ngoc Nguyen Tram
Purchase Details
Closed on
Dec 11, 2013
Sold by
Nguyen Lap C and Tran Ngoc B
Bought by
Nguyen Lac P
Purchase Details
Closed on
May 28, 1998
Sold by
Espinosa Cecilia C and Mae Virginia
Bought by
Nguyen Lap C and Tran Ngoc B
Home Financials for this Owner
Home Financials are based on the most recent Mortgage that was taken out on this home.
Original Mortgage
$88,255
Interest Rate
7.27%
Mortgage Type
Stand Alone First
Create a Home Valuation Report for This Property
The Home Valuation Report is an in-depth analysis detailing your home's value as well as a comparison with similar homes in the area
Home Values in the Area
Average Home Value in this Area
Purchase History
| Date | Buyer | Sale Price | Title Company |
|---|---|---|---|
| Nguyen Tram Ngoc | $150,000 | None Available | |
| Mcclure Philip L | -- | None Available | |
| Nguyen Thoa Ngoc | -- | None Available | |
| Ngoc Nguyen Tram | $57,500 | None Available | |
| Nguyen Lap C | -- | None Available | |
| Nguyen Lac P | -- | None Available | |
| Nguyen Lap C | $92,900 | -- |
Source: Public Records
Mortgage History
| Date | Status | Borrower | Loan Amount |
|---|---|---|---|
| Previous Owner | Nguyen Lap C | $88,255 |
Source: Public Records
Tax History Compared to Growth
Tax History
| Year | Tax Paid | Tax Assessment Tax Assessment Total Assessment is a certain percentage of the fair market value that is determined by local assessors to be the total taxable value of land and additions on the property. | Land | Improvement |
|---|---|---|---|---|
| 2024 | $1,719 | $21,710 | $4,520 | $17,190 |
| 2023 | $1,682 | $21,710 | $4,520 | $17,190 |
| 2022 | $1,672 | $21,030 | $8,280 | $12,750 |
| 2021 | $1,614 | $21,630 | $8,520 | $13,110 |
| 2020 | $1,430 | $19,280 | $6,450 | $12,830 |
| 2019 | $1,390 | $19,280 | $6,450 | $12,830 |
| 2018 | $1,013 | $13,090 | $4,640 | $8,450 |
| 2017 | $1,010 | $13,090 | $4,640 | $8,450 |
| 2016 | $858 | $10,520 | $4,354 | $6,166 |
| 2015 | $822 | $10,520 | $4,354 | $6,166 |
| 2014 | $673 | $8,100 | $2,563 | $5,537 |
Source: Public Records
Map
Nearby Homes
- 3245 W Walsh Place
- 3470 W Walsh Place
- 3503 W Ada Place
- 855 S Knox Ct
- 3520 W Center Ave
- 668 S Lowell Blvd
- 3174 W Center Ave
- 3145 W Ada Place
- 3703 W Walsh Place
- 3570 W Center Ave
- 3441 W Ford Place
- 3228 W Virginia Ave
- 3073 W Center Ave Unit A
- 3073 W Center Ave Unit C
- 740 S Eliot St
- 461 S Lowell Blvd
- 3224 W Dakota Ave
- 3947 W Ohio Ave Unit 17
- 1065 S Irving St Unit west half of lot 24
- 3226 W Dakota Ave
- 3390 W Walsh Place
- 3374 W Walsh Place
- 3401 W Walsh Place
- 3409 W Walsh Place
- 3391 W Walsh Place
- 3344 W Walsh Place
- 3422 W Walsh Place
- 3407 W Ohio Ave
- 3377 W Walsh Place
- 3424 W Walsh Place
- 3365 W Walsh Place
- 3415 W Walsh Place
- 3397 W Ohio Ave
- 3340 W Walsh Place
- 3411 W Ohio Ave
- 3387 W Ohio Ave
- 3405 W Ohio Ave
- 3363 W Ohio Ave
- 3335 W Walsh Place
- 3351 W Ohio Ave