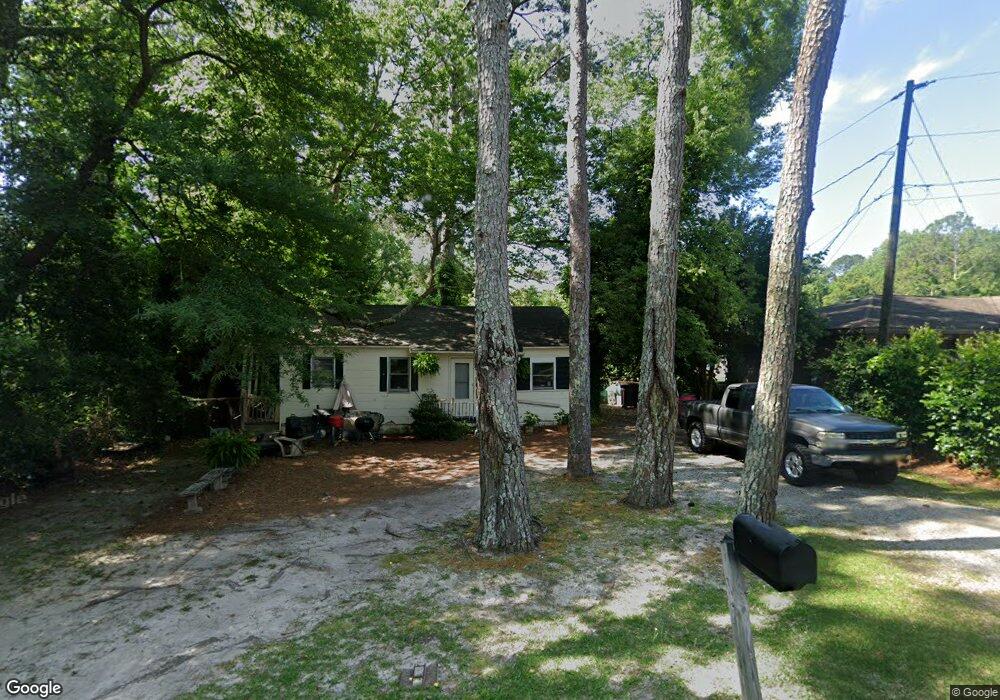
3402 Walker St Macon, GA 31204
Estimated Value: $55,650 - $86,000
3
Beds
1
Bath
850
Sq Ft
$80/Sq Ft
Est. Value
About This Home
This home is located at 3402 Walker St, Macon, GA 31204 and is currently estimated at $67,913, approximately $79 per square foot. 3402 Walker St is a home located in Bibb County with nearby schools including Weaver Middle School, Westside High School, and The Learning Place Academy.
Ownership History
Date
Name
Owned For
Owner Type
Purchase Details
Closed on
Jul 10, 2012
Sold by
Neilser Jeff
Bought by
Reno Matt
Current Estimated Value
Purchase Details
Closed on
Jan 2, 2008
Sold by
Williams Marion A
Bought by
Williams Marion A
Purchase Details
Closed on
Nov 20, 2007
Sold by
Hsbc Bank Usa Na
Bought by
Neisler Jeff
Purchase Details
Closed on
May 1, 2007
Sold by
Nankinga Maureen
Bought by
Hsbc Bank Usa Na and Ace Securities Corp Home Equity Loan Tru
Purchase Details
Closed on
Feb 18, 2005
Sold by
Kabuye Flex
Bought by
Nankinga Maureen
Home Financials for this Owner
Home Financials are based on the most recent Mortgage that was taken out on this home.
Original Mortgage
$52,200
Interest Rate
9.12%
Mortgage Type
Adjustable Rate Mortgage/ARM
Purchase Details
Closed on
Dec 20, 2004
Home Financials for this Owner
Home Financials are based on the most recent Mortgage that was taken out on this home.
Original Mortgage
$52,200
Interest Rate
9.12%
Mortgage Type
Adjustable Rate Mortgage/ARM
Create a Home Valuation Report for This Property
The Home Valuation Report is an in-depth analysis detailing your home's value as well as a comparison with similar homes in the area
Purchase History
| Date | Buyer | Sale Price | Title Company |
|---|---|---|---|
| Reno Matt | $3,500 | None Available | |
| Williams Marion A | -- | None Available | |
| Neisler Jeff | $3,300 | Us Land Title | |
| Hsbc Bank Usa Na | $41,850 | None Available | |
| Nankinga Maureen | $58,000 | None Available | |
| -- | $12,500 | -- |
Source: Public Records
Mortgage History
| Date | Status | Borrower | Loan Amount |
|---|---|---|---|
| Previous Owner | Nankinga Maureen | $52,200 |
Source: Public Records
Tax History
| Year | Tax Paid | Tax Assessment Tax Assessment Total Assessment is a certain percentage of the fair market value that is determined by local assessors to be the total taxable value of land and additions on the property. | Land | Improvement |
|---|---|---|---|---|
| 2025 | $157 | $6,405 | $3,038 | $3,367 |
| 2024 | $161 | $6,323 | $3,262 | $3,061 |
| 2023 | $135 | $5,311 | $2,250 | $3,061 |
| 2022 | $194 | $5,591 | $2,613 | $2,978 |
| 2021 | $202 | $5,320 | $2,613 | $2,707 |
| 2020 | $207 | $5,320 | $2,613 | $2,707 |
| 2019 | $208 | $5,320 | $2,613 | $2,707 |
| 2018 | $499 | $5,320 | $2,613 | $2,707 |
| 2017 | $199 | $5,320 | $2,613 | $2,707 |
| 2016 | $184 | $5,320 | $2,613 | $2,707 |
| 2015 | $261 | $5,320 | $2,613 | $2,707 |
| 2014 | $300 | $5,320 | $2,613 | $2,707 |
Source: Public Records
Map
Nearby Homes
- 3442 Walker St
- 1184 Edna Place
- 1247 Carlisle Ave
- 1350 Brinwood Dr
- 1055 Lamont St
- 3340 Napier Ave
- 3220 Arnwood Ave
- 3260 Toole Dr
- 961 Log Cabin Way
- 3242 Toole Dr
- 3778 Log Cabin Dr
- 1077 Pike St
- 0 Macon Ave Unit 25970106
- 3435 Hillcrest Rd
- 1171 Washington St
- 3890 Robinson Rd
- 3483 Napier Ave
- 3816 Log Cabin Dr
- 3336 Matheson Dr
- 3491 Bond St W
- 1207 Edna Place
- 1213 Edna Place
- 1201 Edna Place
- 1219 Edna Place
- 3411 Walker St
- 3415 Walker St
- 1225 Edna Place
- 3419 Walker St
- 3427 Walker St
- 1187 Edna Place Unit S-1306
- 1187 Edna Place
- 1187 Edna Place
- 1231 Edna Place
- 3431 Walker St
- 1214 Edna Place
- 1220 Edna Place
- 1208 Edna Place
- 1237 Edna Place
- 1226 Edna Place
- 1179 Edna Place
Your Personal Tour Guide
Ask me questions while you tour the home.