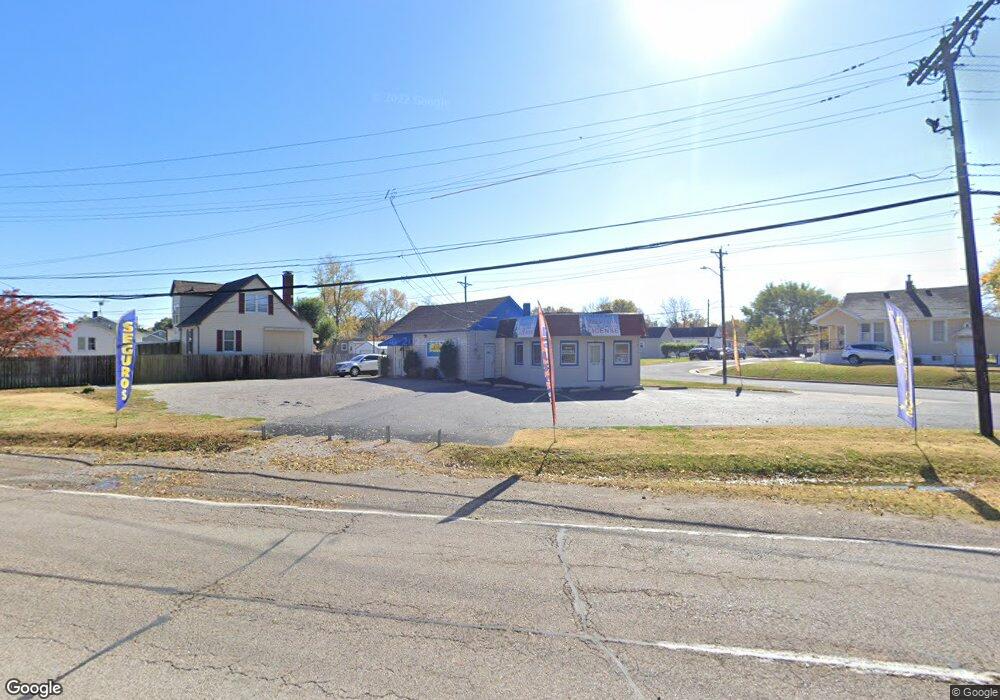
3403 Cookson Rd East Saint Louis, IL 62201
Estimated Value: $62,881
--
Bed
--
Bath
240
Sq Ft
$262/Sq Ft
Est. Value
About This Home
This home is located at 3403 Cookson Rd, East Saint Louis, IL 62201 and is currently estimated at $62,881, approximately $262 per square foot. 3403 Cookson Rd is a home located in St. Clair County with nearby schools including Gordon Bush Elementary School, East St Louis-Lincoln Middle School, and East St Louis Senior High School.
Ownership History
Date
Name
Owned For
Owner Type
Purchase Details
Closed on
Jun 13, 2023
Sold by
Anderson Scott J and Anderson Melanie K
Bought by
Anderson Scott J and Melanie K Anderson Revocable Trust
Current Estimated Value
Purchase Details
Closed on
Dec 18, 2020
Sold by
Gomez Cesario and Gomez Jennifer
Bought by
Anderson Scott J
Purchase Details
Closed on
May 21, 2020
Sold by
Bran Jenise
Bought by
Gomez Jennifer Cesario
Purchase Details
Closed on
Jan 18, 2017
Sold by
Downtown Deals Llc
Bought by
Bravo Denise
Purchase Details
Closed on
Aug 15, 2008
Sold by
Scurry Danny Ray
Bought by
Downtown Deals Llc
Home Financials for this Owner
Home Financials are based on the most recent Mortgage that was taken out on this home.
Original Mortgage
$48,705
Interest Rate
6.42%
Mortgage Type
Commercial
Purchase Details
Closed on
Feb 25, 2006
Sold by
Garcia Gene P
Bought by
Scurry Danny Ray
Create a Home Valuation Report for This Property
The Home Valuation Report is an in-depth analysis detailing your home's value as well as a comparison with similar homes in the area
Home Values in the Area
Average Home Value in this Area
Purchase History
| Date | Buyer | Sale Price | Title Company |
|---|---|---|---|
| Anderson Scott J | -- | None Available | |
| Anderson Scott J | $45,000 | Pontoon Title Co | |
| Gomez Jennifer Cesario | $2,000 | None Available | |
| Bravo Denise | $43,000 | Attorney | |
| Downtown Deals Llc | $57,500 | Title & Escrow Plus Inc | |
| Scurry Danny Ray | $25,000 | Fatic |
Source: Public Records
Mortgage History
| Date | Status | Borrower | Loan Amount |
|---|---|---|---|
| Previous Owner | Downtown Deals Llc | $48,705 |
Source: Public Records
Tax History Compared to Growth
Tax History
| Year | Tax Paid | Tax Assessment Tax Assessment Total Assessment is a certain percentage of the fair market value that is determined by local assessors to be the total taxable value of land and additions on the property. | Land | Improvement |
|---|---|---|---|---|
| 2024 | $1,291 | $15,561 | $2,053 | $13,508 |
| 2023 | $1,283 | $15,165 | $2,001 | $13,164 |
| 2022 | $1,187 | $13,936 | $1,839 | $12,097 |
| 2021 | $1,181 | $13,449 | $1,831 | $11,618 |
| 2020 | $1,172 | $13,520 | $1,841 | $11,679 |
| 2019 | $1,229 | $13,520 | $1,841 | $11,679 |
| 2018 | $1,247 | $13,725 | $1,869 | $11,856 |
| 2017 | $1,092 | $11,703 | $1,793 | $9,910 |
| 2016 | $1,096 | $11,777 | $1,804 | $9,973 |
| 2014 | $1,038 | $11,777 | $1,804 | $9,973 |
| 2013 | $775 | $10,089 | $5,432 | $4,657 |
Source: Public Records
Map
Nearby Homes
- 1342 N 41st St
- 1309 N 43rd St
- 1224 N 42nd St
- 2031 N 42nd St
- 1618 N 42nd St
- 4010 Caseyville Ave
- 1529 N 44th St
- 1445 N 44th St
- 1633 N 50th St
- 1418 N 43rd St
- 1618 N 51st St
- 2215 N 58th St
- 1445 N 55th St
- 4800 Caseyville Ave
- 1926 N 60th St
- 5050 Hallows Ave
- 5150 Rosemont Ave
- 5423 Avon Place
- 1732 N 61st St
- 800 N 24th St
- 3501 Cookson Rd
- 2621 N 35th St
- 2705 N 37th St
- 2701 N 37th St
- 3320 Cookson Rd
- 2709 N 37th St
- 2715 N 37th St
- 2619 N 35th St
- 2618 N 35th St
- 2622 N 33rd St
- 2615 N 35th St
- 3700 Cookson Rd
- 2621 N 37th St
- 2612 N 35th St
- 2704 N 37th St
- 2700 N 37th St
- 2708 N 37th St
- 2712 N 37th St
- 2620 N 33rd St
- 2615 N 37th St