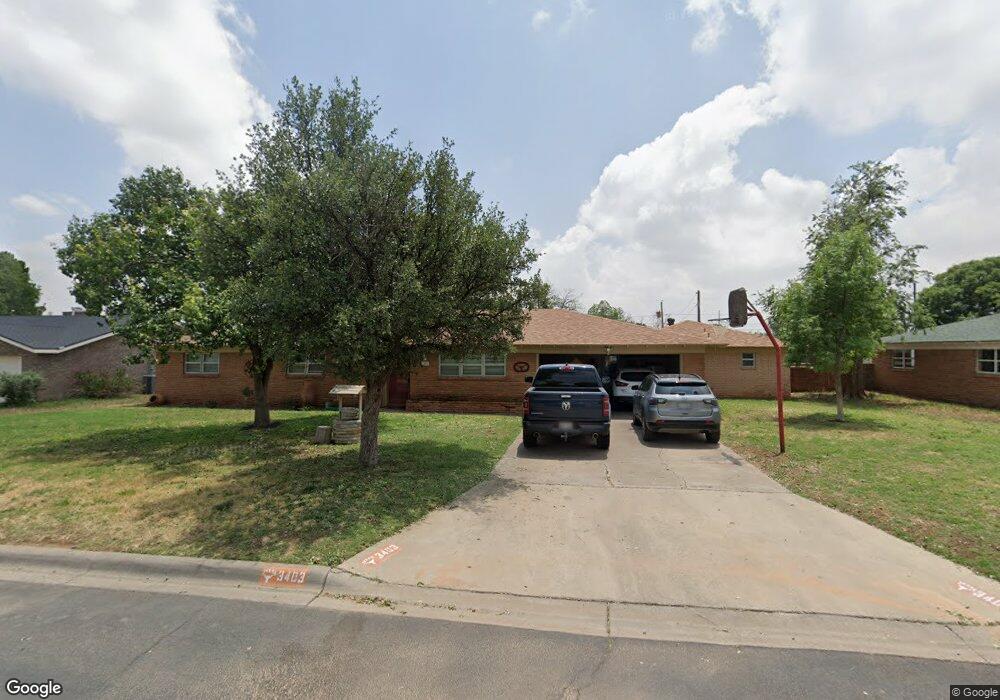
3403 Princeton Ave Midland, TX 79703
Estimated Value: $335,000 - $378,128
--
Bed
2
Baths
2,622
Sq Ft
$138/Sq Ft
Est. Value
About This Home
This home is located at 3403 Princeton Ave, Midland, TX 79703 and is currently estimated at $361,282, approximately $137 per square foot. 3403 Princeton Ave is a home located in Midland County with nearby schools including Alamo Junior High School, Texas Leadership of Midland, and Midland Montessori School.
Ownership History
Date
Name
Owned For
Owner Type
Purchase Details
Closed on
Apr 14, 2009
Sold by
Savage Julie and Jacobs David A
Bought by
Jacobs David A
Current Estimated Value
Home Financials for this Owner
Home Financials are based on the most recent Mortgage that was taken out on this home.
Original Mortgage
$177,175
Outstanding Balance
$112,719
Interest Rate
5.14%
Mortgage Type
Stand Alone Refi Refinance Of Original Loan
Estimated Equity
$248,563
Purchase Details
Closed on
Apr 15, 2008
Sold by
Reed Charles V and Reed Charlotte L
Bought by
Savage Julie and Jacobs David A
Home Financials for this Owner
Home Financials are based on the most recent Mortgage that was taken out on this home.
Original Mortgage
$170,905
Interest Rate
6%
Mortgage Type
Purchase Money Mortgage
Purchase Details
Closed on
Sep 13, 1976
Bought by
Jacobs David A
Create a Home Valuation Report for This Property
The Home Valuation Report is an in-depth analysis detailing your home's value as well as a comparison with similar homes in the area
Home Values in the Area
Average Home Value in this Area
Purchase History
| Date | Buyer | Sale Price | Title Company |
|---|---|---|---|
| Jacobs David A | -- | Netco Title | |
| Savage Julie | -- | Lone Star Abstract & Title C | |
| Jacobs David A | -- | -- |
Source: Public Records
Mortgage History
| Date | Status | Borrower | Loan Amount |
|---|---|---|---|
| Open | Jacobs David A | $177,175 | |
| Closed | Savage Julie | $170,905 |
Source: Public Records
Tax History Compared to Growth
Tax History
| Year | Tax Paid | Tax Assessment Tax Assessment Total Assessment is a certain percentage of the fair market value that is determined by local assessors to be the total taxable value of land and additions on the property. | Land | Improvement |
|---|---|---|---|---|
| 2025 | $3,206 | $264,140 | $39,790 | $224,350 |
| 2024 | $3,211 | $286,530 | $39,790 | $246,740 |
| 2023 | $3,001 | $275,550 | $39,790 | $235,760 |
| 2022 | $4,099 | $262,340 | $39,790 | $222,550 |
| 2021 | $4,518 | $259,340 | $39,790 | $219,550 |
| 2020 | $3,731 | $266,210 | $39,790 | $226,420 |
| 2019 | $4,290 | $226,590 | $39,790 | $226,420 |
| 2018 | $4,005 | $205,990 | $39,790 | $166,200 |
| 2017 | $4,201 | $216,070 | $39,790 | $176,280 |
| 2016 | $4,131 | $212,100 | $39,790 | $172,310 |
| 2015 | -- | $212,100 | $39,790 | $172,310 |
| 2014 | -- | $209,950 | $39,790 | $170,160 |
Source: Public Records
Map
Nearby Homes
- 1103 Tarleton St
- 2607 Bedford Ave
- 3213 Sentinel Dr
- 3300 Storey Ave
- 3312 W Kansas Ave
- 3214 Lockheed Dr
- 3302 W Kansas Ave
- 1502 Alcove Ct
- 3523 Lonoke Ave
- 3204 W Golf Course Rd
- 3217 Baumann Ave
- 3215 Baumann Ave
- 2121 Bonham St
- 3005 Douglas Dr
- 3209 Sinclair Ave
- 1509 Cascade Ct
- 3609 W Kansas Ave
- 1702 Cessna Dr
- 3213 Shell Ave
- 5 Bristol Ct
- 3405 Princeton Ave
- 3401 Princeton Ave
- 3407 Princeton Ave
- 3402 Bedford Ave
- 3404 Bedford Ave
- 3311 Princeton Ave
- 3400 Bedford Ave
- 3402 Princeton Ave
- 3406 Bedford Ave
- 3400 Princeton Ave
- 3404 Princeton Ave
- 3408 Bedford Ave
- 3406 Princeton Ave
- 3309 Princeton Ave
- 3318 Bedford Ave
- 3310 Princeton Ave
- 3308 Princeton Ave
- 3 Lots Upland St
- 3307 Princeton Ave
- 3410 Bedford Ave