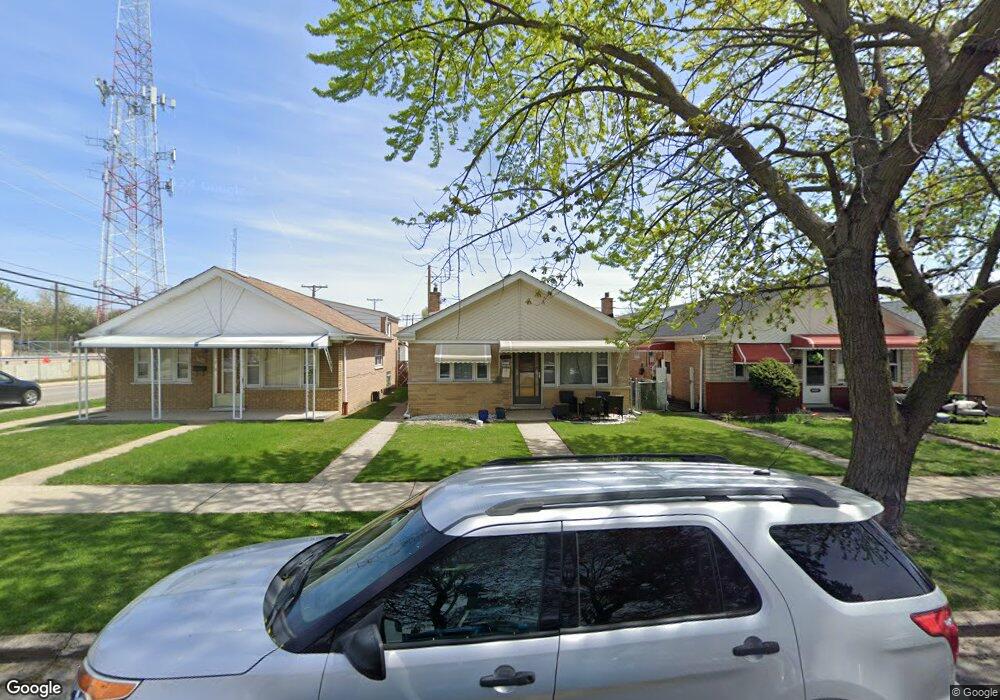
3403 S 55th Ct Cicero, IL 60804
Estimated Value: $223,000 - $300,639
3
Beds
2
Baths
1,008
Sq Ft
$268/Sq Ft
Est. Value
About This Home
This home is located at 3403 S 55th Ct, Cicero, IL 60804 and is currently estimated at $269,910, approximately $267 per square foot. 3403 S 55th Ct is a home located in Cook County with nearby schools including Drexel Elementary School, Unity Jr High School, and J Sterling Morton Freshman Center.
Ownership History
Date
Name
Owned For
Owner Type
Purchase Details
Closed on
Apr 8, 2009
Sold by
Fannie Mae
Bought by
Quintanilla Romanita and Quintanilla Sandra
Current Estimated Value
Home Financials for this Owner
Home Financials are based on the most recent Mortgage that was taken out on this home.
Original Mortgage
$80,000
Outstanding Balance
$50,871
Interest Rate
5.05%
Mortgage Type
Purchase Money Mortgage
Estimated Equity
$219,039
Purchase Details
Closed on
Sep 15, 2008
Sold by
Delgado Tiburcio
Bought by
Federal National Mortgage Association
Purchase Details
Closed on
Jun 1, 2005
Sold by
Nikonchuk Anna M and Nikonchuk Dorothy
Bought by
Delgado Tiburcio
Home Financials for this Owner
Home Financials are based on the most recent Mortgage that was taken out on this home.
Original Mortgage
$188,000
Interest Rate
6.8%
Mortgage Type
Fannie Mae Freddie Mac
Create a Home Valuation Report for This Property
The Home Valuation Report is an in-depth analysis detailing your home's value as well as a comparison with similar homes in the area
Home Values in the Area
Average Home Value in this Area
Purchase History
| Date | Buyer | Sale Price | Title Company |
|---|---|---|---|
| Quintanilla Romanita | -- | Git | |
| Federal National Mortgage Association | -- | None Available | |
| Delgado Tiburcio | $235,000 | Git |
Source: Public Records
Mortgage History
| Date | Status | Borrower | Loan Amount |
|---|---|---|---|
| Open | Quintanilla Romanita | $80,000 | |
| Previous Owner | Delgado Tiburcio | $188,000 |
Source: Public Records
Tax History Compared to Growth
Tax History
| Year | Tax Paid | Tax Assessment Tax Assessment Total Assessment is a certain percentage of the fair market value that is determined by local assessors to be the total taxable value of land and additions on the property. | Land | Improvement |
|---|---|---|---|---|
| 2024 | $6,659 | $23,000 | $4,505 | $18,495 |
| 2023 | $5,120 | $23,000 | $4,505 | $18,495 |
| 2022 | $5,120 | $15,145 | $3,877 | $11,268 |
| 2021 | $5,099 | $15,143 | $3,876 | $11,267 |
| 2020 | $5,053 | $15,143 | $3,876 | $11,267 |
| 2019 | $4,553 | $12,624 | $3,562 | $9,062 |
| 2018 | $4,430 | $12,624 | $3,562 | $9,062 |
| 2017 | $4,298 | $12,624 | $3,562 | $9,062 |
| 2016 | $4,050 | $10,821 | $2,933 | $7,888 |
| 2015 | $3,942 | $10,821 | $2,933 | $7,888 |
| 2014 | $3,819 | $10,821 | $2,933 | $7,888 |
| 2013 | $2,767 | $9,250 | $2,933 | $6,317 |
Source: Public Records
Map
Nearby Homes
- 3413 S 56th Ct
- 3524 S Central Ave
- 3628 54th Ct
- 3529 S 54th Ave
- 3215 S 54th Ct
- 3307 S 58th Ave
- 3539 S 57th Ct
- 3631 S 55th Ct
- 3314 S 58th Ave
- 3141 S 54th Ct
- 3606 S 53rd Ct
- 3116 S 55th Ave
- 3633 S 57th Ct
- 3631 S 54th Ave
- 3131 S 54th Ave
- 3733 S 57th Ave
- 3319 S 59th Ct
- 2214 S Central Ave
- 3632 S 52nd Ct
- 3108 S 53rd Ave