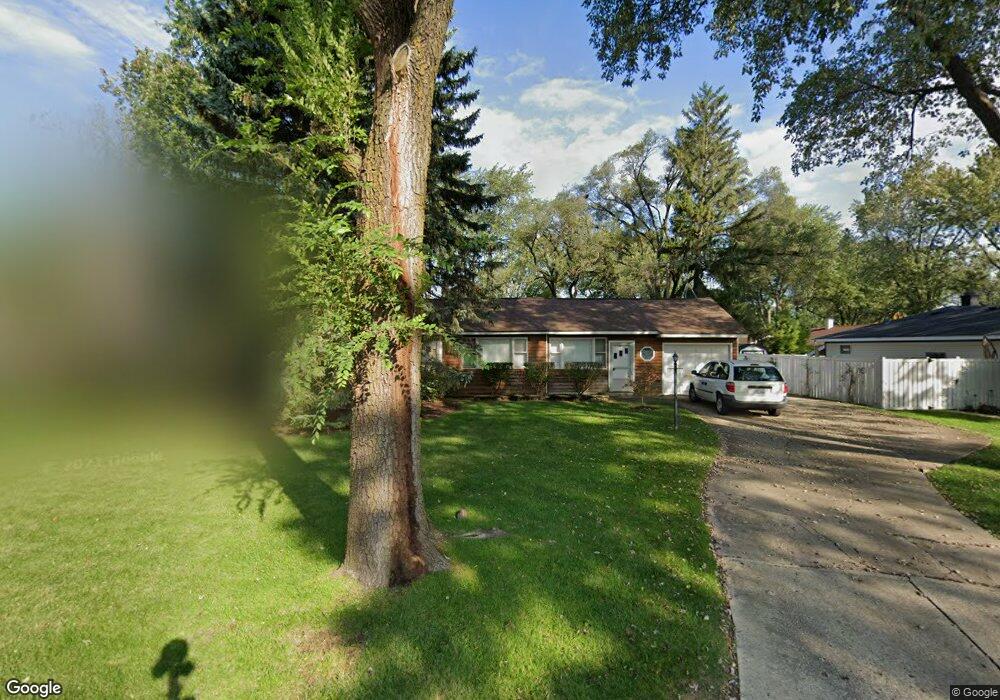
3403 Sigwalt St Rolling Meadows, IL 60008
Estimated Value: $337,000 - $377,000
3
Beds
2
Baths
1,317
Sq Ft
$267/Sq Ft
Est. Value
About This Home
This home is located at 3403 Sigwalt St, Rolling Meadows, IL 60008 and is currently estimated at $351,909, approximately $267 per square foot. 3403 Sigwalt St is a home located in Cook County with nearby schools including Kimball Hill Elementary School, Carl Sandburg Junior High School, and Rolling Meadows High School.
Create a Home Valuation Report for This Property
The Home Valuation Report is an in-depth analysis detailing your home's value as well as a comparison with similar homes in the area
Home Values in the Area
Average Home Value in this Area
Tax History
| Year | Tax Paid | Tax Assessment Tax Assessment Total Assessment is a certain percentage of the fair market value that is determined by local assessors to be the total taxable value of land and additions on the property. | Land | Improvement |
|---|---|---|---|---|
| 2025 | $6,139 | $30,000 | $7,649 | $22,351 |
| 2024 | $6,139 | $26,000 | $6,472 | $19,528 |
| 2023 | $5,824 | $26,000 | $6,472 | $19,528 |
| 2022 | $5,824 | $26,000 | $6,472 | $19,528 |
| 2021 | $4,665 | $20,080 | $3,824 | $16,256 |
| 2020 | $4,688 | $20,080 | $3,824 | $16,256 |
| 2019 | $4,731 | $22,436 | $3,824 | $18,612 |
| 2018 | $4,058 | $19,400 | $3,530 | $15,870 |
| 2017 | $4,870 | $19,400 | $3,530 | $15,870 |
| 2016 | $4,786 | $19,400 | $3,530 | $15,870 |
| 2015 | $3,876 | $15,682 | $3,236 | $12,446 |
| 2014 | $3,805 | $15,682 | $3,236 | $12,446 |
| 2013 | $3,690 | $15,682 | $3,236 | $12,446 |
Source: Public Records
Map
Nearby Homes
- 2401 Rohlwing Rd
- 3265 Kirchoff Rd Unit 116
- 3100 Town Square Dr Unit 308
- 3100 Town Square Dr Unit 204
- 3345 Kirchoff Rd Unit 5C
- 3135 Town Square Dr Unit 401
- 3135 Town Square Dr Unit 104
- 2705 Park St
- 3306 Trillium Cir Unit 3001
- 3209 Trillium Cir
- 2600 Brookwood Way Dr Unit 316
- 2600 Brookwood Way Dr Unit 305
- 2650 Brookwood Way Dr Unit 313
- 2650 Brookwood Way Dr Unit 108
- 2709 Lily Ln
- 3200 Thrush Ln
- 3 Holyoke on Auburn
- 304 E Tall Trees Ln
- 399 Knollwood Ct
- 3710 Meadow Dr
- 3405 Sigwalt St
- 3401 Sigwalt St
- 2605 Cardinal Dr
- 3407 Sigwalt St
- 2603 Cardinal Dr
- 3403 Campbell St
- 3409 Sigwalt St
- 3402 Sigwalt St
- 3405 Campbell St
- 3404 Sigwalt St
- 2701 Cardinal Dr
- 3401 Campbell St
- 2700 Owl Ln
- 3411 Sigwalt St
- 3407 Campbell St
- 2703 Cardinal Dr
- 2606 Cardinal Dr
- 2608 Cardinal Dr
- 3501 Sigwalt St
- 3409 Campbell St
Your Personal Tour Guide
Ask me questions while you tour the home.