
Landlord's Agent in 2025
Dilyara Daminova
Samson Properties
(571) 499-2727
11 in this area
445 Total Sales
Estimated Value: $242,000 - $323,000
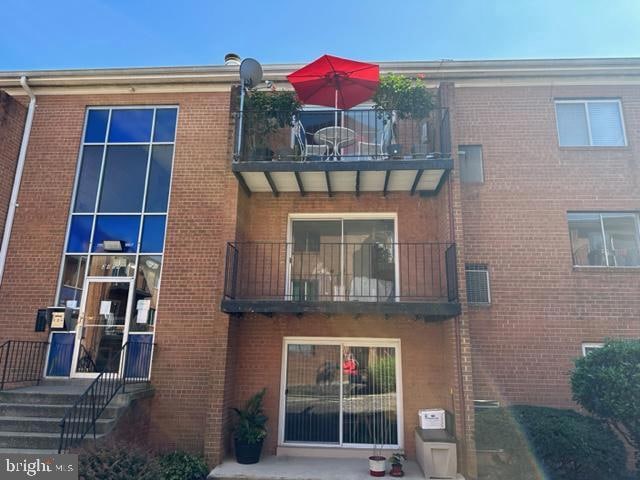
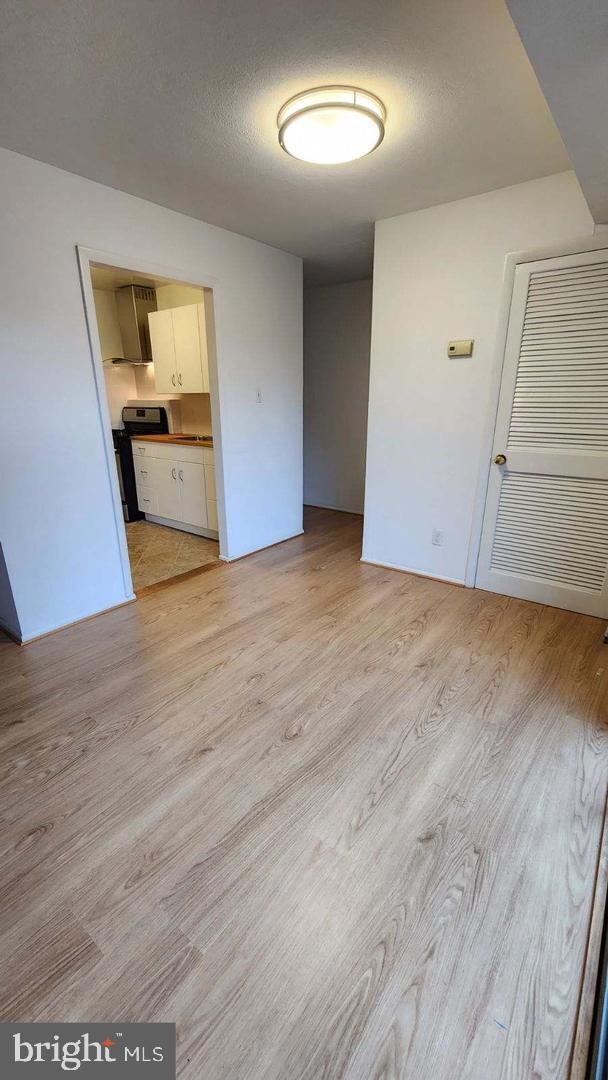
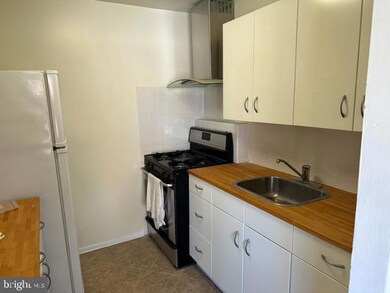
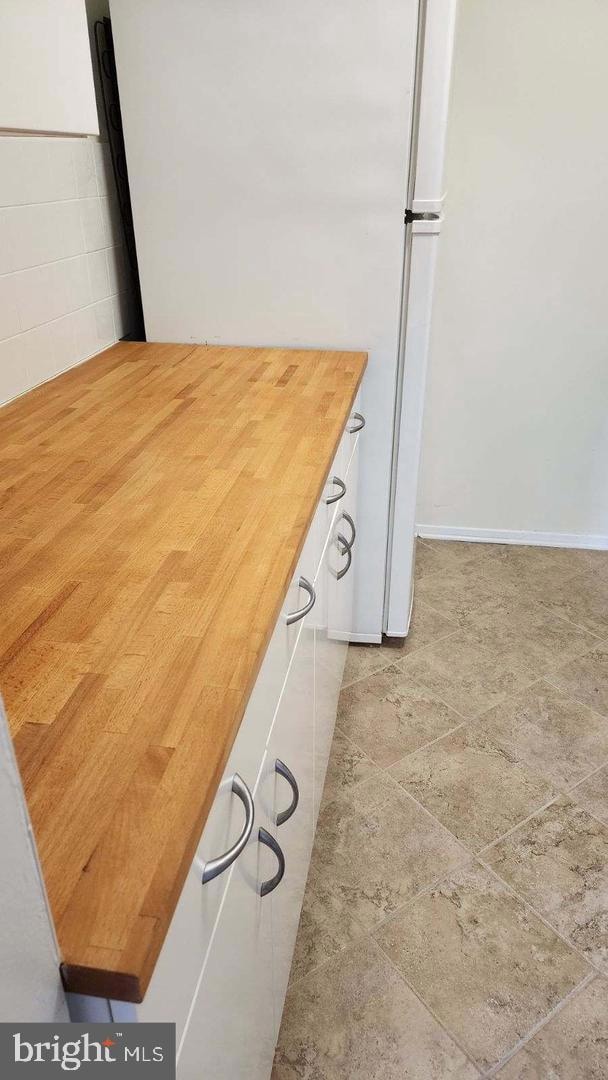
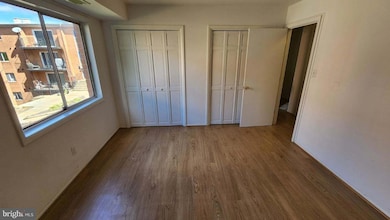
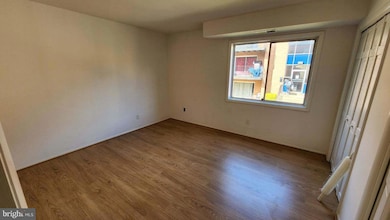
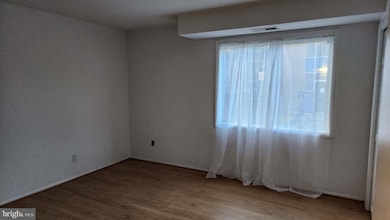
Great location close to everything. Very nice unit move-in ready with nice kitchen and 2 good sized bedrooms. Nice deck to enjoy nice days. Laundry on the lower level of the building. Just minutes to shops, restaurants, and theaters in Shirlington! 4-Mile Run and the W&OD trail are just down the road for jogging, biking, and walking! Easy access to major commuter routes (Rt 395, Glebe Rd), Pentagon, Amazon H2Q, Old Town Alexandria, and Washington DC! Two Metro stations are just minutes away by bus- Pentagon and Pentagon City! Metro Bus stop in front of the condo!
Last Agent to Rent the Property
(703) 378-8810 dilyararealtor@gmail.com Samson Properties License #0225210659 Listed on: 06/21/2025
Last Renter's Agent
(703) 378-8810 donnysamson@samsonproperties.net Samson Properties License #0225270789
| Date | Buyer | Sale Price | Title Company |
|---|---|---|---|
| Crystalgf Llc | $240,000 | Cardinal Title Group |
| Date | Event | Price | List to Sale | Price per Sq Ft | Prior Sale |
|---|---|---|---|---|---|
| 07/13/2025 07/13/25 | Rented | $2,100 | 0.0% | -- | |
| 06/21/2025 06/21/25 | For Rent | $2,100 | +5.0% | -- | |
| 11/21/2023 11/21/23 | Rented | $2,000 | 0.0% | -- | |
| 11/02/2023 11/02/23 | For Rent | $2,000 | 0.0% | -- | |
| 10/30/2023 10/30/23 | Sold | $240,000 | -4.0% | $279 / Sq Ft | View Prior Sale |
| 10/16/2023 10/16/23 | Pending | -- | -- | -- | |
| 10/08/2023 10/08/23 | For Sale | $250,000 | -- | $290 / Sq Ft |
| Year | Tax Paid | Tax Assessment Tax Assessment Total Assessment is a certain percentage of the fair market value that is determined by local assessors to be the total taxable value of land and additions on the property. | Land | Improvement |
|---|---|---|---|---|
| 2025 | $2,381 | $230,500 | $66,300 | $164,200 |
| 2024 | $2,172 | $210,300 | $66,300 | $144,000 |
| 2023 | $2,095 | $203,400 | $66,300 | $137,100 |
| 2022 | $2,081 | $202,000 | $66,300 | $135,700 |
| 2021 | $1,898 | $184,300 | $66,300 | $118,000 |
| 2020 | $1,689 | $164,600 | $34,400 | $130,200 |
| 2019 | $1,613 | $157,200 | $34,400 | $122,800 |
| 2018 | $1,459 | $145,000 | $34,400 | $110,600 |
| 2017 | $1,357 | $134,900 | $34,400 | $100,500 |
| 2016 | $1,317 | $132,900 | $34,400 | $98,500 |
| 2015 | $1,196 | $120,100 | $34,400 | $85,700 |
| 2014 | $994 | $99,800 | $34,400 | $65,400 |
Landlord's Agent in 2025
Dilyara Daminova
Samson Properties
(571) 499-2727
11 in this area
445 Total Sales
A
Tenant's Agent in 2025
Anar Budagov
Samson Properties
(917) 795-2766
4 Total Sales
Seller's Agent in 2023
Scott Thompson
Samson Properties
(301) 639-6072
1 in this area
162 Total Sales
Source: Bright MLS
MLS Number: VAAR2059782
APN: 31-033-075
Disclaimer: Certain information contained herein is derived from information provided by parties other than Homes.com. All information provided is deemed reliable, but is not guaranteed to be accurate and should be independently verified.
![]() The data relating to real estate for sale on this website appears in part through the BRIGHT Internet Data Exchange program, a voluntary cooperative exchange of property listing data between licensed real estate brokerage firms, and is provided by BRIGHT through a licensing agreement.
The data relating to real estate for sale on this website appears in part through the BRIGHT Internet Data Exchange program, a voluntary cooperative exchange of property listing data between licensed real estate brokerage firms, and is provided by BRIGHT through a licensing agreement.
Listing information is from various brokers who participate in the Bright MLS IDX program and not all listings may be visible on the site.
The property information being provided on or through the website is for the personal, non-commercial use of consumers and such information may not be used for any purpose other than to identify prospective properties consumers may be interested in purchasing.
Some properties which appear for sale on the website may no longer be available because they are for instance, under contract, sold or are no longer being offered for sale.
Property information displayed is deemed reliable but is not guaranteed.
Copyright 2026 Bright MLS, Inc.
Ask me questions while you tour the home.