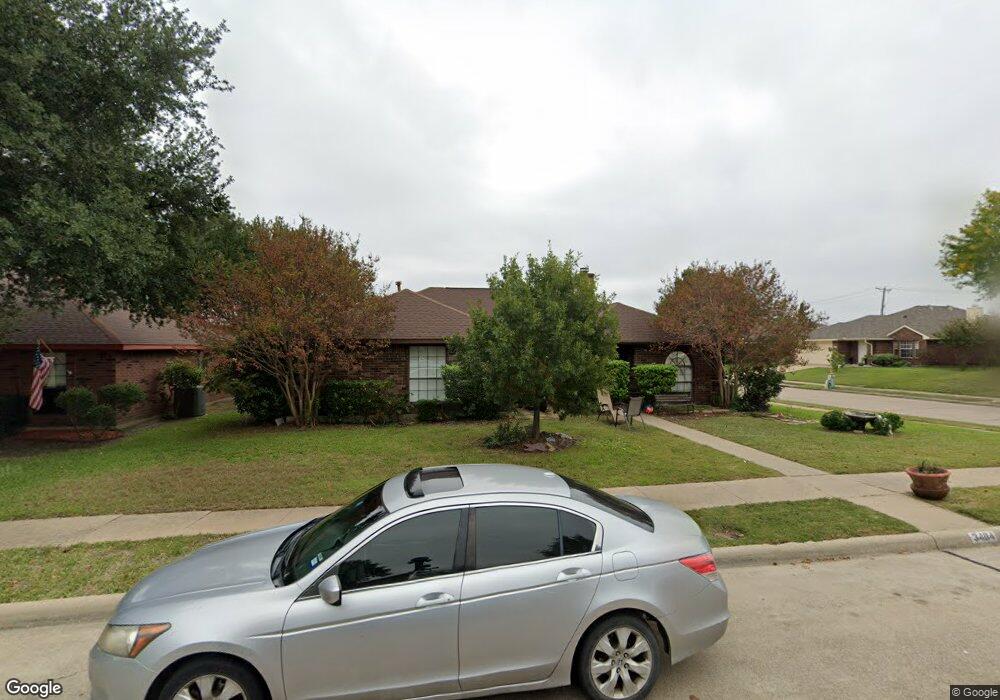
3404 Aster Ln Rowlett, TX 75089
Flower Hill NeighborhoodEstimated Value: $338,119 - $384,000
3
Beds
2
Baths
2,254
Sq Ft
$159/Sq Ft
Est. Value
About This Home
This home is located at 3404 Aster Ln, Rowlett, TX 75089 and is currently estimated at $357,280, approximately $158 per square foot. 3404 Aster Ln is a home located in Dallas County with nearby schools including Harmony School of Innovation - Garland, Wesleyan Christian Academy, and Providence Academy.
Ownership History
Date
Name
Owned For
Owner Type
Purchase Details
Closed on
Jan 8, 2020
Sold by
Maxvill Robert Bernard
Bought by
Maxvill Robert Bernard and Grant Nelly Felicita
Current Estimated Value
Purchase Details
Closed on
Sep 24, 2002
Sold by
Ostergand Ronald
Bought by
Cor Investments Inc
Purchase Details
Closed on
Apr 5, 2002
Sold by
Crestmark Properties Inc
Bought by
Ostergard Ronald A and Construction Management Group
Home Financials for this Owner
Home Financials are based on the most recent Mortgage that was taken out on this home.
Original Mortgage
$112,000
Interest Rate
6.83%
Mortgage Type
Purchase Money Mortgage
Purchase Details
Closed on
Sep 25, 1997
Sold by
Maxvill Miriam M
Bought by
Maxvill Robert B
Home Financials for this Owner
Home Financials are based on the most recent Mortgage that was taken out on this home.
Original Mortgage
$88,300
Interest Rate
6.92%
Create a Home Valuation Report for This Property
The Home Valuation Report is an in-depth analysis detailing your home's value as well as a comparison with similar homes in the area
Home Values in the Area
Average Home Value in this Area
Purchase History
| Date | Buyer | Sale Price | Title Company |
|---|---|---|---|
| Maxvill Robert Bernard | -- | None Available | |
| Cor Investments Inc | -- | Ranger Title Co | |
| Ostergard Ronald A | -- | -- | |
| Maxvill Robert B | -- | -- |
Source: Public Records
Mortgage History
| Date | Status | Borrower | Loan Amount |
|---|---|---|---|
| Previous Owner | Ostergard Ronald A | $112,000 | |
| Previous Owner | Maxvill Robert B | $88,300 | |
| Closed | Maxvill Robert B | $10,000 |
Source: Public Records
Tax History
| Year | Tax Paid | Tax Assessment Tax Assessment Total Assessment is a certain percentage of the fair market value that is determined by local assessors to be the total taxable value of land and additions on the property. | Land | Improvement |
|---|---|---|---|---|
| 2025 | $8,127 | $365,720 | $65,000 | $300,720 |
| 2024 | $8,127 | $365,720 | $65,000 | $300,720 |
| 2023 | $8,127 | $287,740 | $55,000 | $232,740 |
| 2022 | $7,527 | $310,620 | $55,000 | $255,620 |
| 2021 | $5,785 | $224,050 | $0 | $0 |
| 2020 | $5,917 | $224,050 | $50,000 | $174,050 |
| 2019 | $5,999 | $208,770 | $38,000 | $170,770 |
| 2018 | $6,042 | $208,770 | $38,000 | $170,770 |
| 2017 | $5,514 | $190,010 | $38,000 | $152,010 |
| 2016 | $4,629 | $159,520 | $25,000 | $134,520 |
| 2015 | $3,400 | $142,540 | $20,000 | $122,540 |
| 2014 | $3,400 | $125,720 | $20,000 | $105,720 |
Source: Public Records
Map
Nearby Homes
- 3416 Aster Ln
- 3405 Tulip Ln
- 3506 Lily Ln
- 3511 Jasmine Ln
- 5905 Cedar Ln
- 3214 Cedar Ln
- 5610 Magnolia Ln
- 5913 Independence Ct
- 3422 Jonquil Ln
- 5902 Ambassador Ln
- 5516 Maple Ln
- 6004 Mimosa Ln
- 6017 Mimosa Ln
- 5914 Ambassador Ln
- 5609 Freedom Ln
- 6317 Locust St
- 2601 Daisy Ln
- 6416 Rosebud Dr
- 2600 Primrose Ln
- 4401 Big a Rd
Your Personal Tour Guide
Ask me questions while you tour the home.