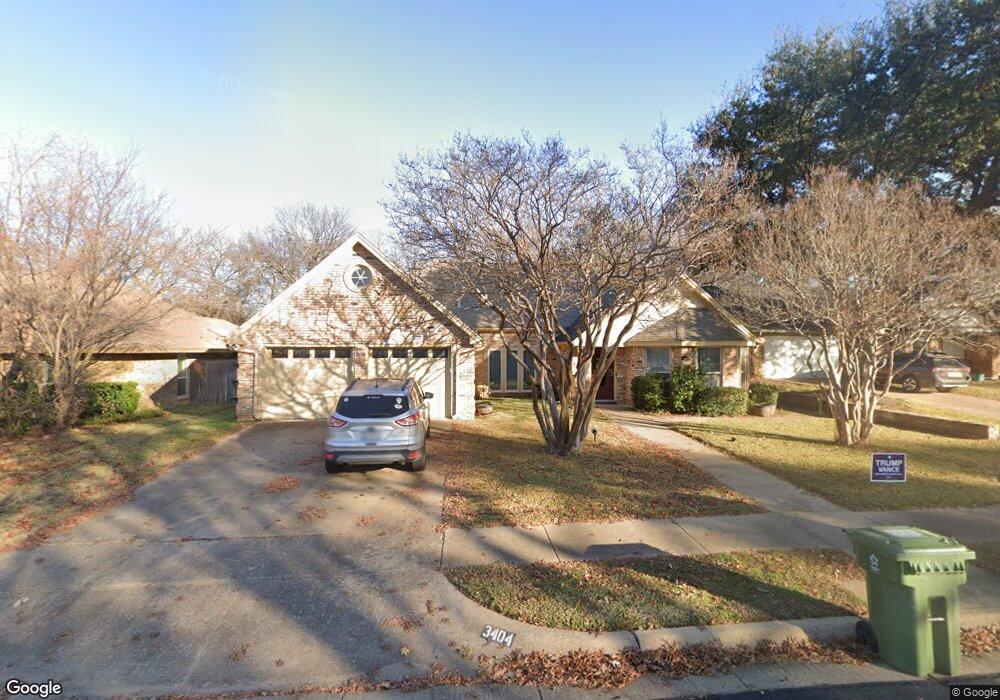
3404 Norman Ln Bedford, TX 76021
Estimated Value: $427,000 - $477,000
3
Beds
2
Baths
2,037
Sq Ft
$222/Sq Ft
Est. Value
About This Home
This home is located at 3404 Norman Ln, Bedford, TX 76021 and is currently estimated at $451,484, approximately $221 per square foot. 3404 Norman Ln is a home located in Tarrant County with nearby schools including Spring Garden Elementary School, Harwood Junior High School, and Trinity High School.
Ownership History
Date
Name
Owned For
Owner Type
Purchase Details
Closed on
Nov 6, 2024
Sold by
Norman Bernadette K
Bought by
Norman Brendan Lee and Norman Briana Nicole
Current Estimated Value
Home Financials for this Owner
Home Financials are based on the most recent Mortgage that was taken out on this home.
Original Mortgage
$246,695
Outstanding Balance
$244,221
Interest Rate
6.08%
Mortgage Type
Seller Take Back
Estimated Equity
$207,263
Purchase Details
Closed on
Jan 5, 2007
Sold by
Galloway Raymond J and Galloway Raymond J
Bought by
Galloway Raymond J and Galloway Living Trust
Purchase Details
Closed on
Jan 31, 1994
Sold by
Galloway Raymond Joseph and Norman Bernadette Katharine Galloway
Bought by
Galloway Raymond Joseph
Create a Home Valuation Report for This Property
The Home Valuation Report is an in-depth analysis detailing your home's value as well as a comparison with similar homes in the area
Home Values in the Area
Average Home Value in this Area
Purchase History
| Date | Buyer | Sale Price | Title Company |
|---|---|---|---|
| Norman Brendan Lee | -- | None Listed On Document | |
| Norman Bernadette K | -- | None Listed On Document | |
| Galloway Raymond J | -- | None Available | |
| Galloway Raymond Joseph | -- | -- |
Source: Public Records
Mortgage History
| Date | Status | Borrower | Loan Amount |
|---|---|---|---|
| Open | Norman Bernadette K | $246,695 |
Source: Public Records
Tax History Compared to Growth
Tax History
| Year | Tax Paid | Tax Assessment Tax Assessment Total Assessment is a certain percentage of the fair market value that is determined by local assessors to be the total taxable value of land and additions on the property. | Land | Improvement |
|---|---|---|---|---|
| 2025 | $8,294 | $379,921 | $85,000 | $294,921 |
| 2024 | $8,294 | $426,005 | $85,000 | $341,005 |
| 2023 | $7,742 | $403,641 | $60,000 | $343,641 |
| 2022 | $7,538 | $404,618 | $60,000 | $344,618 |
| 2021 | $7,391 | $328,004 | $60,000 | $268,004 |
| 2020 | $6,781 | $319,148 | $60,000 | $259,148 |
| 2019 | $6,299 | $321,107 | $60,000 | $261,107 |
| 2018 | $2,473 | $235,720 | $60,000 | $175,720 |
| 2017 | $5,184 | $272,613 | $40,000 | $232,613 |
| 2016 | $4,713 | $239,803 | $40,000 | $199,803 |
| 2015 | $2,481 | $177,100 | $25,000 | $152,100 |
| 2014 | $2,481 | $177,100 | $25,000 | $152,100 |
Source: Public Records
Map
Nearby Homes
- 1800 Hampton Dr
- 1704 Indian Oaks Ct
- 1636 Bedford Oaks Dr
- 3532 Meadowside Dr
- 3513 Meadowside Dr
- 1723 Post Oak Dr
- 1820 Wimbleton Dr
- 1630 Post Oak Dr
- 2901 Miles Way
- 37 Devonshire Dr
- 2209 Laurel Ct
- 22 Lincolnshire Cir
- 1401 Danielle Dr
- 1209 Hillandale Ct
- 3301 Wendover Ct
- 3827 Ashbury Ln
- 3840 Edgewater Dr
- 2220 Tiffany Glenn Ct
- 3813 Brookridge Ct
- 3152 Woodbridge Dr
- 3400 Norman Ln
- 3412 Norman Ln
- 3401 Norman Ln
- 3324 Norman Ln
- 1804 Glenbrook Ct
- 3405 Norman Ln
- 3320 Norman Ln
- 3416 Norman Ln
- 3333 Norman Ln
- 1800 Glenbrook Ct
- 3316 Norman Ln
- 3409 Norman Ln
- 1729 Saxon Dr
- 1733 Saxon Dr
- 3312 Norman Ln
- 1808 Glenbrook Ct
- 1725 Saxon Dr
- 3329 Norman Ln
- 3420 Norman Ln
- 3413 Norman Ln