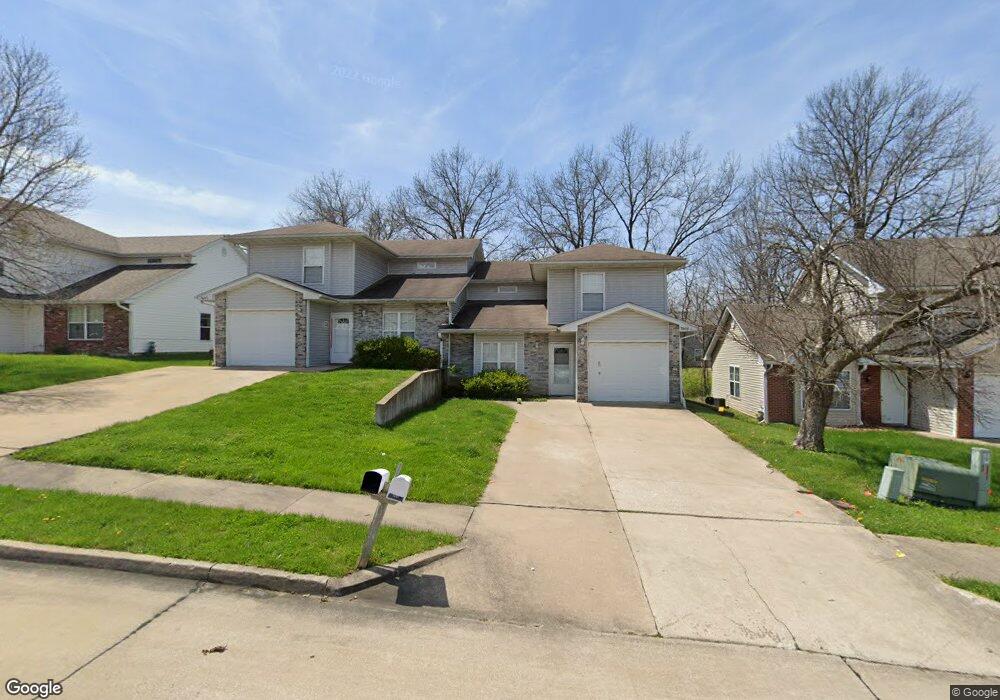
3405 Squirrel Dr Unit 7 Columbia, MO 65202
Estimated Value: $294,000 - $364,000
6
Beds
4
Baths
3,000
Sq Ft
$111/Sq Ft
Est. Value
About This Home
This home is located at 3405 Squirrel Dr Unit 7, Columbia, MO 65202 and is currently estimated at $333,399, approximately $111 per square foot. 3405 Squirrel Dr Unit 7 is a home located in Boone County with nearby schools including Parkade Elementary School, West Middle School, and David H. Hickman High School.
Ownership History
Date
Name
Owned For
Owner Type
Purchase Details
Closed on
Apr 8, 2015
Sold by
Thompson Joseph E
Bought by
Pryor Tammie
Current Estimated Value
Home Financials for this Owner
Home Financials are based on the most recent Mortgage that was taken out on this home.
Original Mortgage
$171,321
Outstanding Balance
$131,934
Interest Rate
3.75%
Mortgage Type
FHA
Estimated Equity
$201,465
Purchase Details
Closed on
Dec 23, 2011
Sold by
Thompson Joseph E and Thompson Tracie
Bought by
Thompson Joseph E
Purchase Details
Closed on
Mar 31, 2005
Sold by
Roetzel Sean
Bought by
Thompson Joseph E
Home Financials for this Owner
Home Financials are based on the most recent Mortgage that was taken out on this home.
Original Mortgage
$178,250
Interest Rate
7.37%
Mortgage Type
Adjustable Rate Mortgage/ARM
Create a Home Valuation Report for This Property
The Home Valuation Report is an in-depth analysis detailing your home's value as well as a comparison with similar homes in the area
Purchase History
| Date | Buyer | Sale Price | Title Company |
|---|---|---|---|
| Pryor Tammie | -- | Boone Central Title Co | |
| Thompson Joseph E | -- | None Available | |
| Thompson Joseph E | -- | None Available |
Source: Public Records
Mortgage History
| Date | Status | Borrower | Loan Amount |
|---|---|---|---|
| Open | Pryor Tammie | $171,321 | |
| Previous Owner | Thompson Joseph E | $178,250 |
Source: Public Records
Tax History
| Year | Tax Paid | Tax Assessment Tax Assessment Total Assessment is a certain percentage of the fair market value that is determined by local assessors to be the total taxable value of land and additions on the property. | Land | Improvement |
|---|---|---|---|---|
| 2025 | $2,394 | $36,556 | $5,016 | $31,540 |
| 2024 | $2,242 | $33,231 | $5,016 | $28,215 |
| 2023 | $2,223 | $33,231 | $5,016 | $28,215 |
| 2022 | $2,136 | $31,958 | $5,016 | $26,942 |
| 2021 | $2,140 | $31,958 | $5,016 | $26,942 |
| 2020 | $2,190 | $30,726 | $5,016 | $25,710 |
| 2019 | $2,190 | $30,726 | $5,016 | $25,710 |
| 2018 | $2,120 | $0 | $0 | $0 |
| 2017 | $2,091 | $29,545 | $5,016 | $24,529 |
| 2016 | $2,091 | $29,545 | $5,016 | $24,529 |
| 2015 | $1,920 | $29,545 | $5,016 | $24,529 |
| 2014 | -- | $29,545 | $5,016 | $24,529 |
Source: Public Records
Map
Nearby Homes
- 203 Caribou Dr
- 303 Caribou Dr
- 510 Cheetah Dr
- 3811 Panther Dr
- 0 Rangeline St
- 4203 Gladden Ln
- LOT 152 Sullivan St
- 200 Corcoran Dr
- LOT 116 Corcoran Dr
- 2502 Bear Bluff Dr
- LOT 246 Peregrine Place
- 3910 Clydesdale Dr
- LOT 151 Sullivan St
- 231 Peregrine Place
- LOT 122 Celebrant Ct
- LOT 134 Celebrant Ct
- LOT 230 Corcoran Dr
- 4305 Peregrine Place
- LOT 229 Corcoran Dr
- LOT 149 Sullivan St
- 3405 Squirrel Dr Unit 3405-3407
- 3409 Squirrel Dr
- 3409 Squirrel Dr Unit 3409-3411
- 3409-3411 Squirrel Dr
- 3313 Squirrel Dr
- 3401 Squirrel Dr Unit 3
- 3401-3403 Squirrel Dr
- L 204 Squirrel Dr
- L 203 Squirrel Dr
- L 202 Squirrel Dr
- 3329-3331 Dove Dr
- 3329 Dove Dr Unit 3331
- 3325-3327 Dove Dr
- 3325 Dove Dr Unit 3327
- 3413-3415 Squirrel Dr
- 3327 Dove Dr
- 3413 Squirrel Dr Unit 3415
- 3323 Dove Dr
- 3410 Squirrel Dr
- 3400 Squirrel Dr Unit 3402
Your Personal Tour Guide
Ask me questions while you tour the home.