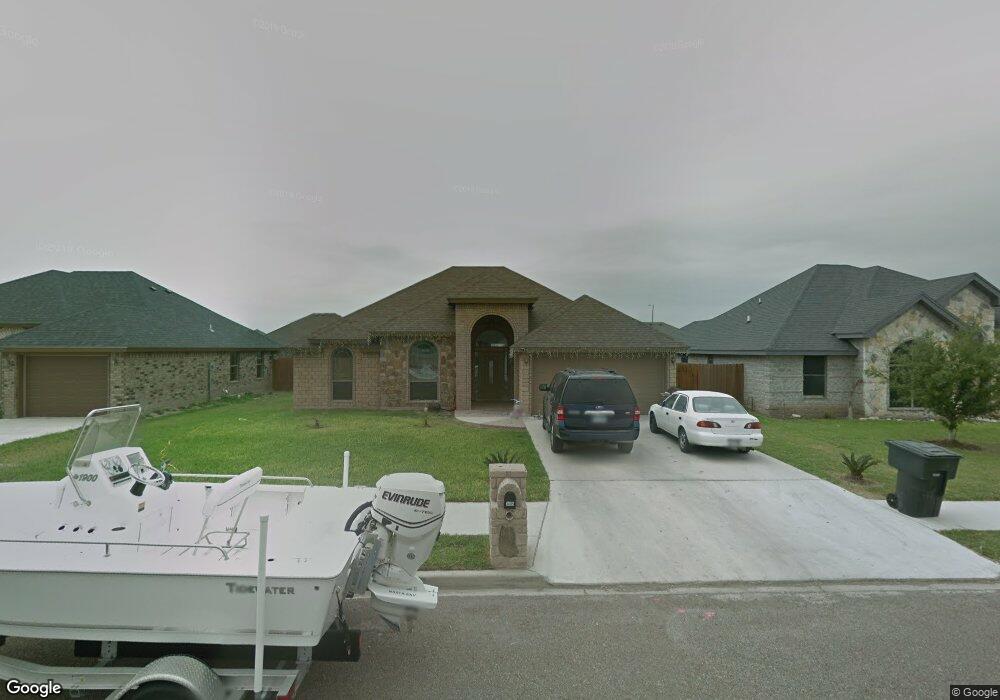
3405 Superior Dr Weslaco, TX 78599
Estimated Value: $223,000 - $269,000
4
Beds
2
Baths
1,722
Sq Ft
$140/Sq Ft
Est. Value
About This Home
This home is located at 3405 Superior Dr, Weslaco, TX 78599 and is currently estimated at $241,915, approximately $140 per square foot. 3405 Superior Dr is a home located in Hidalgo County with nearby schools including Rodolfo Rudy Silva Jr. Elementary School, Beatriz G. Garza Middle School, and Weslaco High School.
Ownership History
Date
Name
Owned For
Owner Type
Purchase Details
Closed on
Aug 15, 2008
Sold by
Garcia Juan
Bought by
Alvarez Efrain L and Lial Eusevio
Current Estimated Value
Home Financials for this Owner
Home Financials are based on the most recent Mortgage that was taken out on this home.
Original Mortgage
$127,991
Outstanding Balance
$84,374
Interest Rate
6.42%
Mortgage Type
Purchase Money Mortgage
Estimated Equity
$157,541
Purchase Details
Closed on
Apr 24, 2008
Sold by
Red Barn Development Llp
Bought by
Garcia Juan
Purchase Details
Closed on
Jun 5, 2007
Sold by
Hinojosa Maria Joaquina
Bought by
Red Barn Development Llp and Benchmark Farms & Ranches Inc
Purchase Details
Closed on
Jan 20, 2006
Sold by
Red Barn Development Lllp
Bought by
Hinojsa Maria Joaquina
Home Financials for this Owner
Home Financials are based on the most recent Mortgage that was taken out on this home.
Original Mortgage
$14,250
Interest Rate
6.1%
Create a Home Valuation Report for This Property
The Home Valuation Report is an in-depth analysis detailing your home's value as well as a comparison with similar homes in the area
Home Values in the Area
Average Home Value in this Area
Purchase History
| Date | Buyer | Sale Price | Title Company |
|---|---|---|---|
| Alvarez Efrain L | -- | Sierra Title | |
| Garcia Juan | -- | Sierra Title | |
| Red Barn Development Llp | $16,237 | None Available | |
| Hinojsa Maria Joaquina | -- | None Available |
Source: Public Records
Mortgage History
| Date | Status | Borrower | Loan Amount |
|---|---|---|---|
| Open | Alvarez Efrain L | $127,991 | |
| Previous Owner | Hinojsa Maria Joaquina | $14,250 |
Source: Public Records
Tax History Compared to Growth
Tax History
| Year | Tax Paid | Tax Assessment Tax Assessment Total Assessment is a certain percentage of the fair market value that is determined by local assessors to be the total taxable value of land and additions on the property. | Land | Improvement |
|---|---|---|---|---|
| 2025 | $5,799 | $211,763 | $43,260 | $168,503 |
| 2024 | $5,799 | $228,924 | $43,260 | $185,664 |
| 2023 | $5,055 | $200,024 | $36,771 | $163,253 |
| 2022 | $4,578 | $178,848 | $36,771 | $142,077 |
| 2021 | $4,001 | $153,923 | $36,771 | $117,152 |
| 2020 | $4,142 | $155,245 | $36,771 | $118,474 |
| 2019 | $3,799 | $139,208 | $19,776 | $119,432 |
| 2018 | $3,414 | $124,781 | $19,776 | $105,005 |
| 2017 | $3,433 | $125,933 | $19,776 | $106,157 |
| 2016 | $3,074 | $112,786 | $13,596 | $99,190 |
| 2015 | $2,901 | $113,852 | $13,596 | $100,256 |
Source: Public Records
Map
Nearby Homes
- 3504 Rosewood Dr
- 3312 Sanoma Dr
- 2316 Zinnia St
- 2200 Zinnia St
- 2404 Zinnia St
- 3501 Everglade Dr
- 1407 Gardenia St
- 1415 Gardenia St
- 1501 Gardenia St
- 717 N Park Place Dr
- 0 N Mile 5 1 2 W Unit 485917
- 703 Bowie St
- 1408 Truvia Ln
- 2711 Stevia Dr
- 2708 Stevia Dr
- 3216 Maria Jose Dr
- 519 Coves Ln
- 3507 Jessica Ln Unit 2
- 3507 Jessica Ln Unit 1
- 2719 N Ohio Ave
- 3409 Superior Dr
- 3401 Superior Dr
- 3404 Cascade Dr
- 3408 Cascade Dr
- 3400 Cascade Dr Unit 35
- 3317 Superior Dr
- 3404 Superior Dr
- 3316 Cascade Dr
- 042 Superior Dr
- 3400 Superior Dr
- 3408 Superior Dr
- 3313 Superior Dr
- 3316 Superior Dr
- 2802 Tahoe Dr
- 2720 Tahoe Dr
- 3312 Cascade Dr
- 2806 Tahoe Dr
- 2716 Tahoe Dr
- 036 Cascade Dr
- 033 Cascade Dr