Estimated Value: $388,000 - $417,000
3
Beds
2
Baths
2,006
Sq Ft
$201/Sq Ft
Est. Value
About This Home
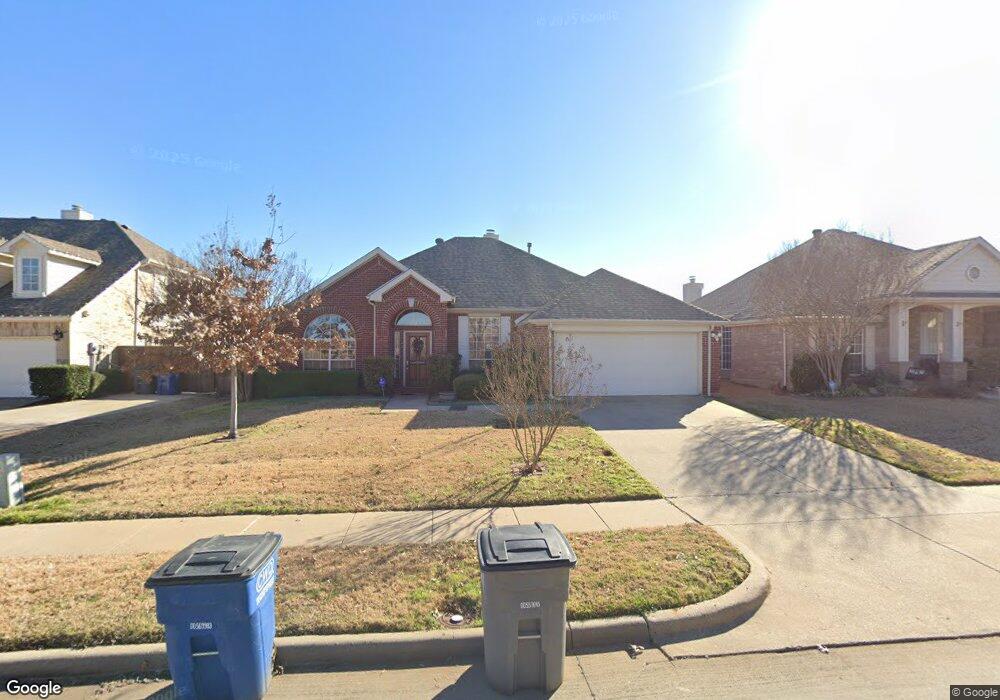
This home is located at 3406 Brookside Dr, Wylie, TX 75098 and is currently estimated at $402,358, approximately $200 per square foot. 3406 Brookside Dr is a home located in Collin County with nearby schools including R V Groves Elementary School, Dr. Al Draper Intermediate Middle School, and Raymond B Cooper J High School.
Ownership History
Date
Name
Owned For
Owner Type
Purchase Details
Closed on
Aug 15, 2012
Sold by
Mangan Jennifer B and Femrite Jennifer Beth
Bought by
Leininger Dorothy and Leininger Wayne
Current Estimated Value
Purchase Details
Closed on
May 24, 2006
Sold by
Sides Steven K and Sides Angela
Bought by
Mangan Jennifer B
Home Financials for this Owner
Home Financials are based on the most recent Mortgage that was taken out on this home.
Original Mortgage
$129,600
Interest Rate
8.67%
Mortgage Type
Fannie Mae Freddie Mac
Purchase Details
Closed on
Jan 19, 2001
Sold by
Ashton Dallas Residential Llc
Bought by
Sides Steven K and Sides Angela
Home Financials for this Owner
Home Financials are based on the most recent Mortgage that was taken out on this home.
Original Mortgage
$145,246
Interest Rate
7.43%
Mortgage Type
FHA
Create a Home Valuation Report for This Property
The Home Valuation Report is an in-depth analysis detailing your home's value as well as a comparison with similar homes in the area
Home Values in the Area
Average Home Value in this Area
Purchase History
| Date | Buyer | Sale Price | Title Company |
|---|---|---|---|
| Leininger Dorothy | -- | Ltic | |
| Mangan Jennifer B | -- | None Available | |
| Sides Steven K | -- | -- |
Source: Public Records
Mortgage History
| Date | Status | Borrower | Loan Amount |
|---|---|---|---|
| Previous Owner | Mangan Jennifer B | $129,600 | |
| Previous Owner | Sides Steven K | $145,246 |
Source: Public Records
Tax History Compared to Growth
Tax History
| Year | Tax Paid | Tax Assessment Tax Assessment Total Assessment is a certain percentage of the fair market value that is determined by local assessors to be the total taxable value of land and additions on the property. | Land | Improvement |
|---|---|---|---|---|
| 2025 | $3,710 | $396,879 | $125,000 | $276,388 |
| 2024 | $3,710 | $360,799 | $125,000 | $255,182 |
| 2023 | $3,710 | $327,999 | $110,000 | $270,528 |
| 2022 | $6,542 | $298,181 | $90,000 | $235,238 |
| 2021 | $6,378 | $271,074 | $70,000 | $201,074 |
| 2020 | $6,369 | $256,496 | $65,000 | $191,496 |
| 2019 | $6,732 | $256,183 | $65,000 | $191,183 |
| 2018 | $6,623 | $245,939 | $65,000 | $180,939 |
| 2017 | $6,300 | $233,929 | $60,000 | $173,929 |
| 2016 | $5,833 | $209,936 | $50,000 | $159,936 |
| 2015 | $4,791 | $187,020 | $45,000 | $142,020 |
Source: Public Records
Map
Nearby Homes
- 802 Appalachian Dr
- 3119 Connor Ln
- 517 Royal Oak Dr
- 3014 Eastwood Dr
- 563 John Ross Rd
- 620 Fall Wheat Dr
- 413 Royal Oak Dr
- 3105 Admiral Dr
- 801 Hunters Glen
- 728 Morningside Trail
- 310 Admiral Dr
- 1205 Periwinkle Dr
- 2912 Katie Cir
- 3111 Candlebrook Dr
- 307 Wooded Creek Ave
- 2907 Abby Ln
- 3003 Candlebrook Dr
- 3017 Eagle Mountain Dr
- 607 Hilltop Dr
- 3103 Creekwood Dr
- 3408 Brookside Dr
- 3404 Brookside Dr
- 3500 Brookside Dr
- 607 Althea Dr
- 802 Bayou Ct
- 3502 Brookside Dr
- 3401 Brookside Dr
- 804 Bayou Ct
- 3500 Abelia Dr
- 605 Althea Dr
- 803 Bayou Ct
- 3402 Brookside Dr
- 3406 Abelia Dr
- 805 Bayou Ct
- 3502 Abelia Dr
- 3404 Abelia Dr
- 608 Althea Dr
- 603 Althea Dr
- 3506 Brookside Dr
- 3400 Brookside Dr