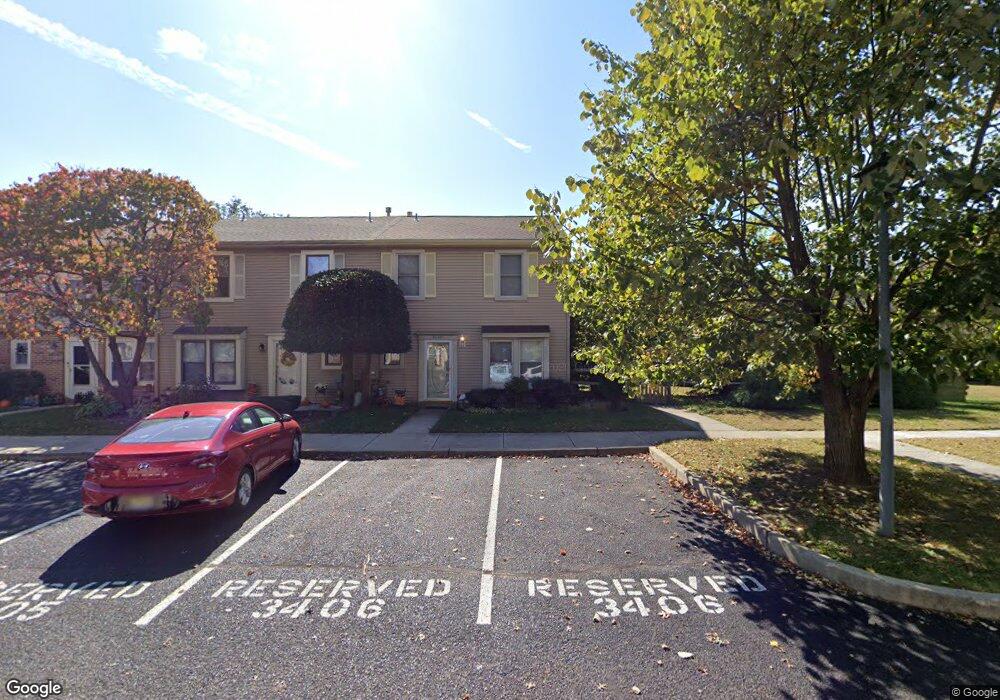
3406 Elberta Ln Marlton, NJ 08053
Estimated Value: $302,000 - $356,000
Studio
--
Bath
1,452
Sq Ft
$224/Sq Ft
Est. Value
About This Home
This home is located at 3406 Elberta Ln, Marlton, NJ 08053 and is currently estimated at $324,789, approximately $223 per square foot. 3406 Elberta Ln is a home located in Burlington County with nearby schools including J. Harold Vanzant Elementary School, Frances Demasi Middle School, and Cherokee High School.
Ownership History
Date
Name
Owned For
Owner Type
Purchase Details
Closed on
Nov 12, 2020
Sold by
Johnson Marcy and Johnson Marcella L
Bought by
Mcdevitt Robert M
Current Estimated Value
Home Financials for this Owner
Home Financials are based on the most recent Mortgage that was taken out on this home.
Original Mortgage
$122,100
Interest Rate
2.7%
Mortgage Type
New Conventional
Purchase Details
Closed on
Jun 1, 2015
Sold by
Bogan Brett
Bought by
Johnson Marcy
Purchase Details
Closed on
Jun 29, 1999
Sold by
Shapiro Faye L and Shapiro Gary I
Bought by
Bogan Brett
Home Financials for this Owner
Home Financials are based on the most recent Mortgage that was taken out on this home.
Original Mortgage
$77,500
Interest Rate
7.19%
Mortgage Type
Balloon
Purchase Details
Closed on
Feb 1, 1995
Sold by
Goldberg Jerome P and Goldberg Mindy
Bought by
Shapiro Gary and Shapiro Faye
Create a Home Valuation Report for This Property
The Home Valuation Report is an in-depth analysis detailing your home's value as well as a comparison with similar homes in the area
Home Values in the Area
Average Home Value in this Area
Purchase History
| Date | Buyer | Sale Price | Title Company |
|---|---|---|---|
| Mcdevitt Robert M | $120,000 | None Listed On Document | |
| Johnson Marcy | $175,000 | Stewart Title Guaranty Co | |
| Bogan Brett | $97,500 | Southern Counties Title Agen | |
| Shapiro Gary | $103,500 | Fidelity Title Abstract Co |
Source: Public Records
Mortgage History
| Date | Status | Borrower | Loan Amount |
|---|---|---|---|
| Previous Owner | Mcdevitt Robert M | $122,100 | |
| Previous Owner | Bogan Brett | $77,500 |
Source: Public Records
Tax History
| Year | Tax Paid | Tax Assessment Tax Assessment Total Assessment is a certain percentage of the fair market value that is determined by local assessors to be the total taxable value of land and additions on the property. | Land | Improvement |
|---|---|---|---|---|
| 2025 | $5,464 | $160,000 | $80,000 | $80,000 |
| 2024 | $5,141 | $160,000 | $80,000 | $80,000 |
| 2023 | $5,141 | $160,000 | $80,000 | $80,000 |
| 2022 | $4,910 | $160,000 | $80,000 | $80,000 |
| 2021 | $4,795 | $160,000 | $80,000 | $80,000 |
| 2020 | $4,733 | $160,000 | $80,000 | $80,000 |
| 2019 | $4,694 | $160,000 | $80,000 | $80,000 |
| 2018 | $4,629 | $160,000 | $80,000 | $80,000 |
| 2017 | $4,574 | $160,000 | $80,000 | $80,000 |
| 2016 | $5,737 | $205,700 | $80,000 | $125,700 |
| 2015 | $5,636 | $205,700 | $80,000 | $125,700 |
| 2014 | $5,476 | $205,700 | $80,000 | $125,700 |
Source: Public Records
Map
Nearby Homes
- 5801 Red Haven Dr
- 906 Chesterwood Ct
- 1107 Chesterwood Ct Unit 1107
- 9 Candlewood Cir
- 224 Teal Ln
- 25 Champlain Rd
- 17 Valley Forge Ct
- 307 Woodhollow Dr
- 23 King Ave
- 716 Woodhollow Dr Unit 716
- 4510 Church Rd
- 14 Merlot Ct
- 1511 Woodhollow Dr
- 1506 Woodhollow Dr Unit 1506
- 11 Claret Ct
- 32 Hearthstone Ln
- 614 Augusta Cir Unit 614
- 234 Fir Tree Ct
- 44 Ashley Ct
- 63 Banner Ct Unit 63
- 3405 Elberta Ln
- 3601 Elberta Ln
- 3403 Elberta Ln
- 3602 Elberta Ln
- 3402 Elberta Ln
- 3603 Elberta Ln
- 3401 Elberta Ln
- 3604 Elberta Ln
- 2402 Elberta Ln
- 2403 Elberta Ln
- 2404 Elberta Ln
- 2405 Elberta Ln
- 3502 Elberta Ln
- 3306 Elberta Ln
- 2401 Elberta Ln
- 3503 Elberta Ln
- 3605 Elberta Ln
- 3504 Elberta Ln
- 3505 Elberta Ln
Your Personal Tour Guide
Ask me questions while you tour the home.