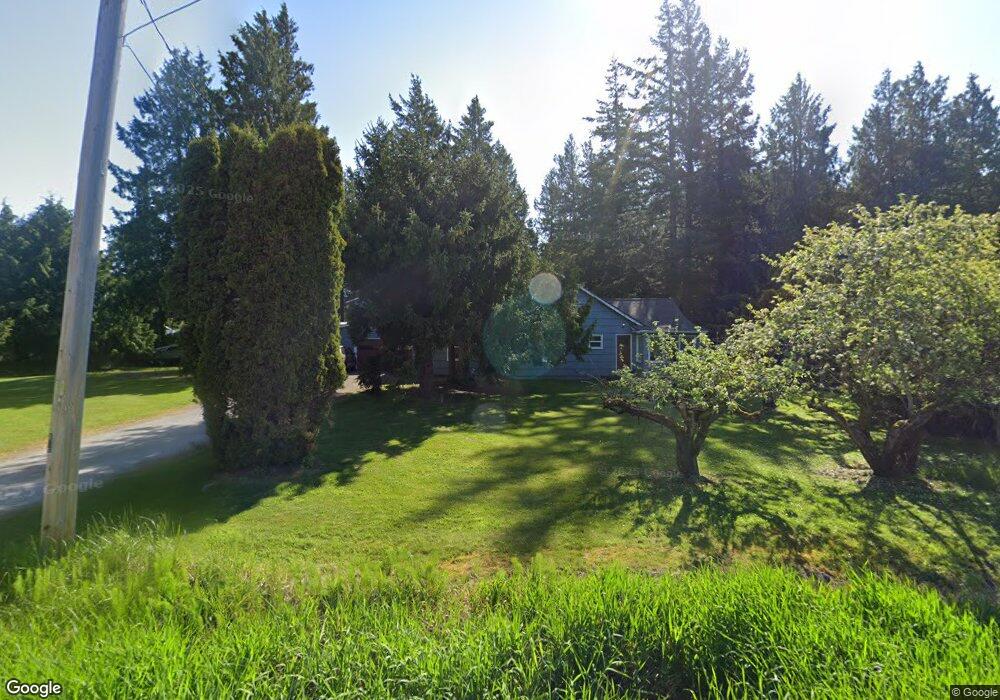
3406 Hollywood Ave Bellingham, WA 98225
Estimated Value: $515,000 - $573,989
4
Beds
1
Bath
1,349
Sq Ft
$402/Sq Ft
Est. Value
About This Home
This home is located at 3406 Hollywood Ave, Bellingham, WA 98225 and is currently estimated at $542,497, approximately $402 per square foot. 3406 Hollywood Ave is a home located in Whatcom County with nearby schools including Alderwood Elementary School, Shuksan Middle School, and Squalicum High School.
Ownership History
Date
Name
Owned For
Owner Type
Purchase Details
Closed on
Jul 16, 2018
Sold by
Chamberlin Norman H and Chamberlin Karen E
Bought by
Chamberlin Roger N and Chamberlin Sheri J
Current Estimated Value
Purchase Details
Closed on
Mar 9, 2006
Sold by
Chamberlin Norman
Bought by
Chamberlin Norman and Chamberlin Karen
Home Financials for this Owner
Home Financials are based on the most recent Mortgage that was taken out on this home.
Original Mortgage
$170,000
Interest Rate
6.08%
Mortgage Type
Fannie Mae Freddie Mac
Purchase Details
Closed on
Dec 15, 2005
Sold by
Chamberlin Roger N and Chamberlin Sheri J
Bought by
Chamberlin Norman
Purchase Details
Closed on
Oct 16, 2002
Sold by
Freeman Virgil Bradley
Bought by
Chamberlin Roger N and Chamberlin Sheri J
Home Financials for this Owner
Home Financials are based on the most recent Mortgage that was taken out on this home.
Original Mortgage
$158,400
Interest Rate
5.5%
Create a Home Valuation Report for This Property
The Home Valuation Report is an in-depth analysis detailing your home's value as well as a comparison with similar homes in the area
Home Values in the Area
Average Home Value in this Area
Purchase History
| Date | Buyer | Sale Price | Title Company |
|---|---|---|---|
| Chamberlin Roger N | $304,494 | None Available | |
| Chamberlin Norman | -- | Stewart Title Company | |
| Chamberlin Norman | -- | -- | |
| Chamberlin Roger N | $170,191 | Chicago Title Insurance |
Source: Public Records
Mortgage History
| Date | Status | Borrower | Loan Amount |
|---|---|---|---|
| Previous Owner | Chamberlin Norman | $170,000 | |
| Previous Owner | Chamberlin Roger N | $158,400 |
Source: Public Records
Tax History Compared to Growth
Tax History
| Year | Tax Paid | Tax Assessment Tax Assessment Total Assessment is a certain percentage of the fair market value that is determined by local assessors to be the total taxable value of land and additions on the property. | Land | Improvement |
|---|---|---|---|---|
| 2024 | $4,571 | $505,344 | $263,736 | $241,608 |
| 2023 | $4,571 | $527,571 | $275,336 | $252,235 |
| 2022 | $3,835 | $428,918 | $223,850 | $205,068 |
| 2021 | $3,067 | $354,478 | $185,000 | $169,478 |
| 2020 | $2,863 | $266,758 | $132,405 | $134,353 |
| 2019 | $2,552 | $249,281 | $123,803 | $125,478 |
| 2018 | $2,632 | $223,594 | $111,053 | $112,541 |
| 2017 | $2,295 | $197,837 | $98,260 | $99,577 |
| 2016 | $2,026 | $179,854 | $89,420 | $90,434 |
| 2015 | $2,147 | $171,251 | $85,000 | $86,251 |
| 2014 | -- | $176,525 | $88,752 | $87,773 |
| 2013 | -- | $169,573 | $86,000 | $83,573 |
Source: Public Records
Map
Nearby Homes
- 3411 Hollywood Ave
- 3333 Hollywood Ave
- 3311 Redwood Ave Unit 13
- 3241 W Mcleod Rd
- 3222 Mcleod Rd
- 3851 Cliffside Dr
- 3116 Alderwood Ave
- 3161 Locust Ave
- 3085 W Maplewood Ave
- 44 XX Pacific Hwy
- 4434 Pacific Hwy
- 4154 Pacific Hwy
- 1365 Mahogany Ave
- 2850 W Maplewood Ave
- 3025 Cedarwood Ave
- 4225 Ambrosia Ln
- 4227 Ambrosia Ln
- 4229 Ambrosia Ln
- 0 Home Ln
- 4231 Ambrosia Ln
- 3404 Hollywood Ave
- 3410 Hollywood Ave
- 3402 Hollywood Ave
- 3443 W Mcleod Rd
- 3417 Hollywood Ave
- 3502 Alderwood Ave
- 3433 W Mcleod Rd
- 3506 Alderwood Ave
- 3440 Alderwood Ave
- 3425 Hollywood Ave
- 3442 W Mcleod Rd
- 3508 Alderwood Ave
- 3434 Alderwood Ave
- 3430 Alderwood Ave
- 3449 Alderwood Ave
- 3444 W Mcleod Rd
- 3501 Alderwood Ave
- 3505 Alderwood Ave
- 3510 Alderwood Ave
- 3372 Hollywood Ave