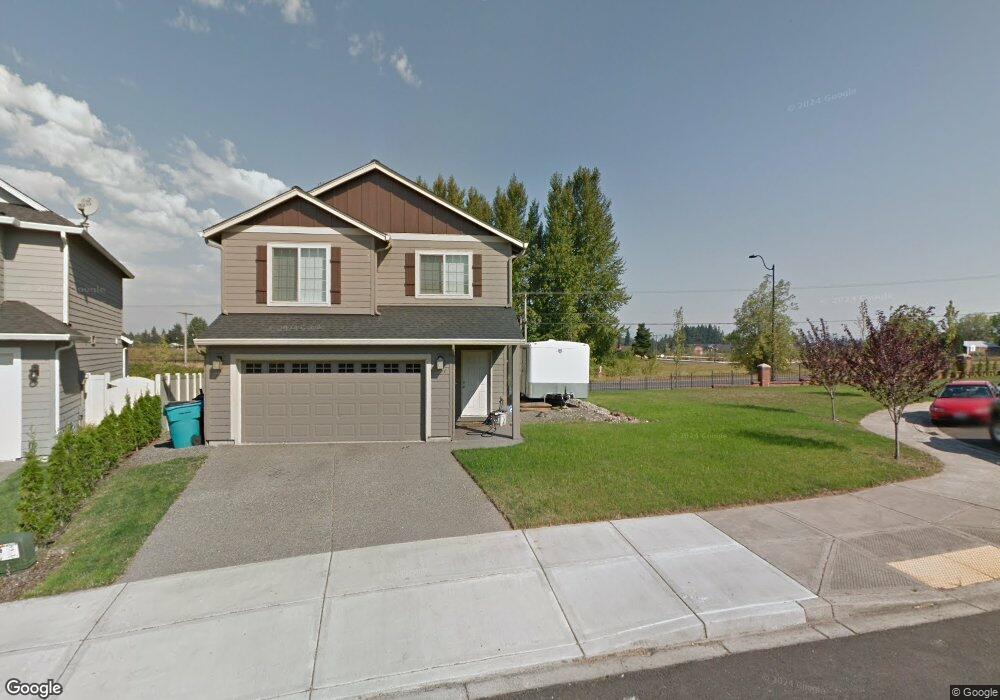
3406 S 1st Cir Unit 73 Ridgefield, WA 98642
Estimated Value: $504,000 - $532,000
3
Beds
3
Baths
1,688
Sq Ft
$304/Sq Ft
Est. Value
About This Home
This home is located at 3406 S 1st Cir Unit 73, Ridgefield, WA 98642 and is currently estimated at $512,699, approximately $303 per square foot. 3406 S 1st Cir Unit 73 is a home located in Clark County with nearby schools including Ridgefield High School and Mountain View Christian School.
Ownership History
Date
Name
Owned For
Owner Type
Purchase Details
Closed on
Jan 28, 2011
Sold by
Aho Construction I Inc
Bought by
Baisa Dan
Current Estimated Value
Home Financials for this Owner
Home Financials are based on the most recent Mortgage that was taken out on this home.
Original Mortgage
$80,000
Outstanding Balance
$29,698
Interest Rate
4.82%
Mortgage Type
New Conventional
Estimated Equity
$483,001
Purchase Details
Closed on
Aug 23, 2010
Sold by
Community Financial Corp
Bought by
Aho Construction I Inc
Home Financials for this Owner
Home Financials are based on the most recent Mortgage that was taken out on this home.
Original Mortgage
$492,000
Interest Rate
4.52%
Mortgage Type
Seller Take Back
Purchase Details
Closed on
Feb 8, 2010
Sold by
Sun Country Homes Inc
Bought by
Community Financial Corporation
Create a Home Valuation Report for This Property
The Home Valuation Report is an in-depth analysis detailing your home's value as well as a comparison with similar homes in the area
Home Values in the Area
Average Home Value in this Area
Purchase History
| Date | Buyer | Sale Price | Title Company |
|---|---|---|---|
| Baisa Dan | $186,650 | Stewart Title | |
| Aho Construction I Inc | $105,000 | Clark County Title | |
| Community Financial Corporation | $110,703 | Fidelity National Title |
Source: Public Records
Mortgage History
| Date | Status | Borrower | Loan Amount |
|---|---|---|---|
| Open | Baisa Dan | $80,000 | |
| Previous Owner | Aho Construction I Inc | $492,000 |
Source: Public Records
Tax History Compared to Growth
Tax History
| Year | Tax Paid | Tax Assessment Tax Assessment Total Assessment is a certain percentage of the fair market value that is determined by local assessors to be the total taxable value of land and additions on the property. | Land | Improvement |
|---|---|---|---|---|
| 2025 | $3,790 | $428,649 | $145,000 | $283,649 |
| 2024 | $3,639 | $427,563 | $145,000 | $282,563 |
| 2023 | $3,233 | $437,398 | $145,000 | $292,398 |
| 2022 | $3,058 | $371,905 | $104,423 | $267,482 |
| 2021 | $2,961 | $329,064 | $97,500 | $231,564 |
| 2020 | $2,961 | $298,117 | $91,000 | $207,117 |
| 2019 | $2,856 | $294,101 | $86,678 | $207,423 |
| 2018 | $2,929 | $286,607 | $0 | $0 |
| 2017 | $2,201 | $253,764 | $0 | $0 |
| 2016 | $2,055 | $225,234 | $0 | $0 |
| 2015 | $2,068 | $201,460 | $0 | $0 |
| 2014 | -- | $194,052 | $0 | $0 |
| 2013 | -- | $164,435 | $0 | $0 |
Source: Public Records
Map
Nearby Homes
- 4784 Pioneer St
- 3204 S 2nd Way
- 2650 S 4th Way
- 3150 S 3rd Way
- 251 N Green Gables Loop
- 3047 S Cedar Ridge Dr
- 4523 S 39th Dr
- 4532 S 39th Dr
- 4517 S 39th Dr
- 4504 S 39th Dr
- 1108 S 48th Place
- 204 N 38th Place
- 3505 N Pioneer Canyon Dr
- 351 S 39th Dr
- 208 N 30th Dr
- 252 N 30th Dr
- 203 N 40th Ave
- 3102 N Pioneer Canyon Dr
- 2805 N 2nd Way
- 3012 N Pioneer Canyon Dr
- 3406 S 1st Cir
- 3404 S 1st Cir
- 3551 S 1st Cir
- 3553 S 1st Cir
- 3555 S 1st Cir
- 3502 S 1st Cir
- 3502 S 1st Cir Unit 72
- 3402 S 1st Cir
- 3405 S 1st Cir
- 3407 S 1st Cir
- 0 Pioneer St
- 3501 S 1st Cir
- 3403 S 1st Cir
- 3504 S 1st Cir
- 3503 S 1st Cir
- 119 S 34th Place
- 3505 S 1st Cir
- 000 Pioneer St
- 3414 S 2nd Way
- 3412 S 2nd Way