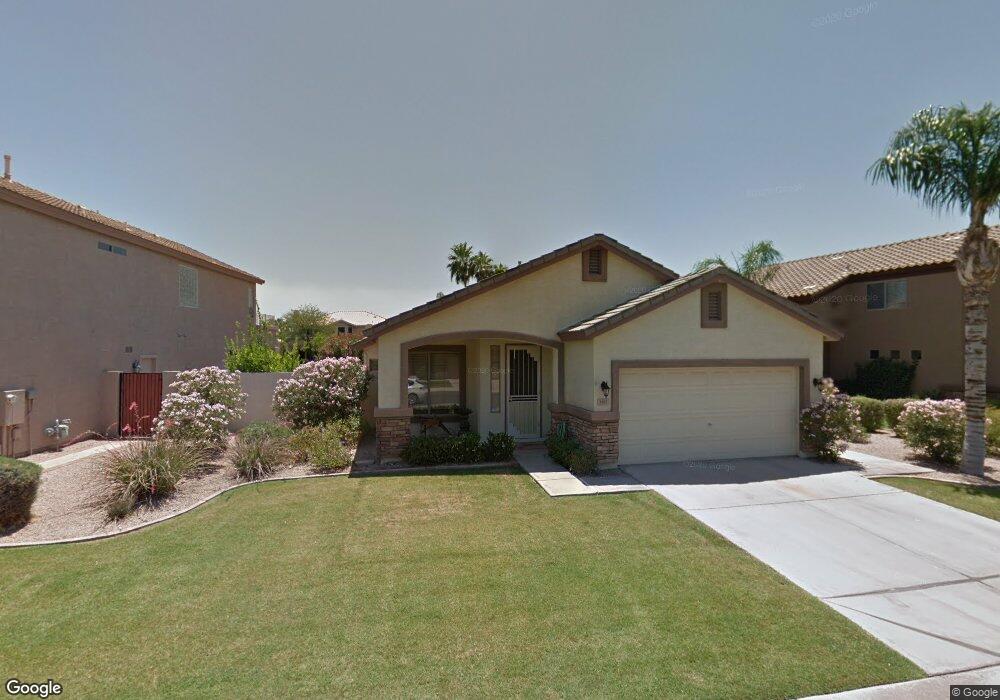
3407 S Felix Way Chandler, AZ 85248
Ocotillo NeighborhoodEstimated Value: $541,084 - $680,000
--
Bed
2
Baths
1,746
Sq Ft
$360/Sq Ft
Est. Value
About This Home
This home is located at 3407 S Felix Way, Chandler, AZ 85248 and is currently estimated at $629,021, approximately $360 per square foot. 3407 S Felix Way is a home located in Maricopa County with nearby schools including Basha Elementary School, Bogle Junior High School, and Hamilton High School.
Ownership History
Date
Name
Owned For
Owner Type
Purchase Details
Closed on
Jun 1, 2025
Sold by
Becker Pamela F and Osborn John M
Bought by
Good Vibes Revocable Trust and Osborn
Current Estimated Value
Purchase Details
Closed on
Sep 26, 2014
Sold by
Osborn John M and Becker Pam
Bought by
Becker Pamela F and Osborn John M
Home Financials for this Owner
Home Financials are based on the most recent Mortgage that was taken out on this home.
Original Mortgage
$135,000
Interest Rate
4.08%
Mortgage Type
New Conventional
Purchase Details
Closed on
Oct 19, 1999
Sold by
Edens Robert H and Edens Glenda R
Bought by
Osborn John M and Becker Pam
Home Financials for this Owner
Home Financials are based on the most recent Mortgage that was taken out on this home.
Original Mortgage
$161,250
Interest Rate
7.82%
Mortgage Type
New Conventional
Purchase Details
Closed on
Dec 19, 1996
Sold by
The Keystone Companies Inc
Bought by
Edens Robert H and Edens Glenda R
Home Financials for this Owner
Home Financials are based on the most recent Mortgage that was taken out on this home.
Original Mortgage
$127,740
Interest Rate
7.54%
Mortgage Type
New Conventional
Create a Home Valuation Report for This Property
The Home Valuation Report is an in-depth analysis detailing your home's value as well as a comparison with similar homes in the area
Home Values in the Area
Average Home Value in this Area
Purchase History
| Date | Buyer | Sale Price | Title Company |
|---|---|---|---|
| Good Vibes Revocable Trust | -- | None Listed On Document | |
| Becker Pamela F | -- | First Arizona Title Agency | |
| Osborn John M | $177,000 | Security Title Agency | |
| Edens Robert H | $159,676 | Transnation Title Ins Co |
Source: Public Records
Mortgage History
| Date | Status | Borrower | Loan Amount |
|---|---|---|---|
| Previous Owner | Becker Pamela F | $135,000 | |
| Previous Owner | Osborn John M | $161,250 | |
| Previous Owner | Edens Robert H | $127,740 |
Source: Public Records
Tax History Compared to Growth
Tax History
| Year | Tax Paid | Tax Assessment Tax Assessment Total Assessment is a certain percentage of the fair market value that is determined by local assessors to be the total taxable value of land and additions on the property. | Land | Improvement |
|---|---|---|---|---|
| 2025 | $2,399 | $30,803 | -- | -- |
| 2024 | $2,318 | $29,336 | -- | -- |
| 2023 | $2,318 | $46,480 | $9,290 | $37,190 |
| 2022 | $2,236 | $34,270 | $6,850 | $27,420 |
| 2021 | $2,344 | $32,450 | $6,490 | $25,960 |
| 2020 | $2,333 | $30,870 | $6,170 | $24,700 |
| 2019 | $2,244 | $26,830 | $5,360 | $21,470 |
| 2018 | $2,173 | $25,550 | $5,110 | $20,440 |
| 2017 | $2,025 | $23,380 | $4,670 | $18,710 |
| 2016 | $1,951 | $23,670 | $4,730 | $18,940 |
| 2015 | $1,891 | $21,780 | $4,350 | $17,430 |
Source: Public Records
Map
Nearby Homes
- 3540 S Mcclelland Dr
- 974 W Desert Broom Ct
- 776 W Carob Way
- 3201 S Horizon Place
- 757 W Carob Way
- 1222 W Honeysuckle Ln
- 714 W Desert Broom Dr
- 631 W Azalea Dr
- 705 W Queen Creek Rd Unit 2126
- 705 W Queen Creek Rd Unit 2146
- 705 W Queen Creek Rd Unit 1201
- 705 W Queen Creek Rd Unit 2062
- 705 W Queen Creek Rd Unit 1010
- 505 W Hemlock Way Unit 7
- 3235 S Purple Sage Dr
- 3763 S Rosemary Dr
- 443 W Lantana Place
- 947 W Ebony Dr
- 3901 S Tumbleweed Ln Unit 2
- 2981 S Sean Dr
- 3399 S Felix Way
- 3415 S Felix Way
- 3391 S Felix Way
- 3383 S Felix Way
- 965 W Hackberry Ct
- 3439 S Felix Way
- 3408 S Felix Way
- 3416 S Felix Way
- 3416 S Felix Way
- 3424 S Felix Way
- 3416 S Emerson St
- 3375 S Felix Way
- 3432 S Felix Way
- 3426 S Emerson St
- 3447 S Felix Way
- 971 W Hackberry Ct
- 3406 S Emerson St
- 3440 S Felix Way
- 3436 S Emerson St
- 3367 S Felix Way