Estimated Value: $501,000 - $526,942
4
Beds
3
Baths
2,526
Sq Ft
$205/Sq Ft
Est. Value
About This Home
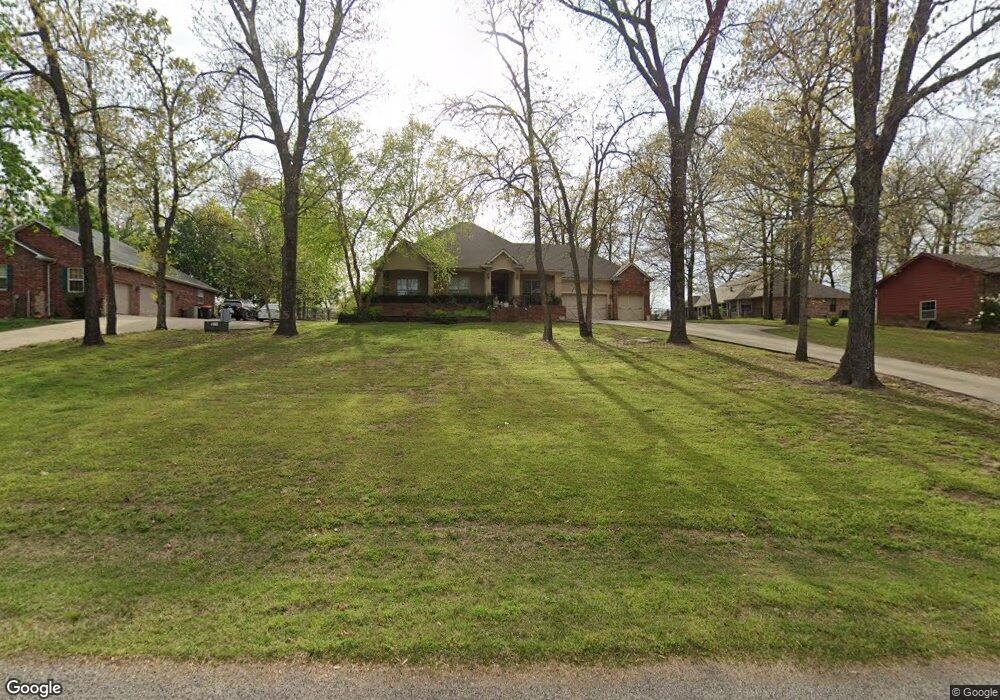
This home is located at 3408 Scenic Dr Unit VII, Grove, OK 74344 and is currently estimated at $518,986, approximately $205 per square foot. 3408 Scenic Dr Unit VII is a home located in Delaware County with nearby schools including Grove Lower Elementary School, Grove Upper Elementary School, and Grove Middle School.
Ownership History
Date
Name
Owned For
Owner Type
Purchase Details
Closed on
Sep 24, 2013
Sold by
Walker Edith
Bought by
Walker Edith and Jon S Walker Revocable Living Trust
Current Estimated Value
Purchase Details
Closed on
Sep 20, 2013
Sold by
Hughes Aaron and Hughes Dana
Bought by
Walker Edith
Purchase Details
Closed on
Nov 23, 2010
Sold by
Cox Kevin and Cox Glenda
Bought by
Hughes Aaron and Hughes Dana
Home Financials for this Owner
Home Financials are based on the most recent Mortgage that was taken out on this home.
Original Mortgage
$200,000
Interest Rate
4.17%
Mortgage Type
Future Advance Clause Open End Mortgage
Purchase Details
Closed on
Feb 29, 2008
Sold by
Rambo William H and Rambo Sharon
Bought by
Cox Kevin and Cox Glenda
Home Financials for this Owner
Home Financials are based on the most recent Mortgage that was taken out on this home.
Original Mortgage
$230,400
Interest Rate
5.47%
Mortgage Type
New Conventional
Create a Home Valuation Report for This Property
The Home Valuation Report is an in-depth analysis detailing your home's value as well as a comparison with similar homes in the area
Home Values in the Area
Average Home Value in this Area
Purchase History
| Date | Buyer | Sale Price | Title Company |
|---|---|---|---|
| Walker Edith | -- | None Available | |
| Walker Edith | $257,000 | None Available | |
| Hughes Aaron | $250,000 | -- | |
| Cox Kevin | $288,000 | -- |
Source: Public Records
Mortgage History
| Date | Status | Borrower | Loan Amount |
|---|---|---|---|
| Previous Owner | Hughes Aaron | $200,000 | |
| Previous Owner | Cox Kevin | $230,400 |
Source: Public Records
Tax History Compared to Growth
Tax History
| Year | Tax Paid | Tax Assessment Tax Assessment Total Assessment is a certain percentage of the fair market value that is determined by local assessors to be the total taxable value of land and additions on the property. | Land | Improvement |
|---|---|---|---|---|
| 2025 | $2,727 | $35,365 | $2,944 | $32,421 |
| 2024 | $2,727 | $33,681 | $2,804 | $30,877 |
| 2023 | $2,727 | $32,077 | $2,721 | $29,356 |
| 2022 | $2,551 | $32,078 | $2,703 | $29,375 |
| 2021 | $2,424 | $29,733 | $2,703 | $27,030 |
| 2020 | $2,348 | $27,710 | $2,703 | $25,007 |
| 2019 | $2,396 | $28,178 | $2,703 | $25,475 |
| 2018 | $2,320 | $27,338 | $2,703 | $24,635 |
| 2017 | $2,386 | $28,027 | $2,703 | $25,324 |
| 2016 | $2,414 | $28,373 | $2,588 | $25,785 |
| 2015 | $2,449 | $28,373 | $2,588 | $25,785 |
| 2014 | $2,461 | $28,373 | $2,588 | $25,785 |
Source: Public Records
Map
Nearby Homes
- 3405 Callie Dr
- 3410 Scenic Dr
- 3401 Callie Dr
- 3407 Callie Dr
- 3403 Callie Dr
- 3409 Scenic Dr
- 3412 Scenic Dr Unit VII
- 3411 Scenic Dr
- 3409 Callie Dr
- 3413 Callie Dr
- Lot 61 Callie Dr
- 0 Callie Dr
- Lot 44 Callie Dr
- Lot 55 Callie Dr
- 3412 Callie Dr
- 3413 Scenic Dr
- 3405 Scenic Dr
- 3414 Scenic Dr
- 3410 Callie Dr
- 3402 Callie Dr