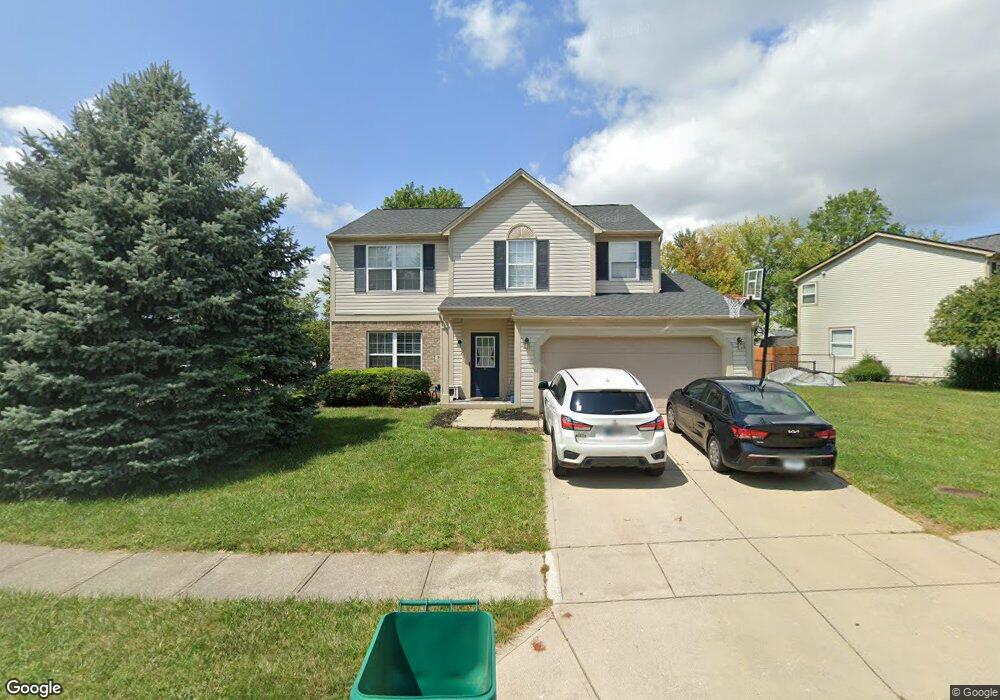
3408 Trillium Ct Westfield, IN 46074
West Noblesville NeighborhoodEstimated Value: $334,000 - $355,377
4
Beds
3
Baths
1,906
Sq Ft
$179/Sq Ft
Est. Value
About This Home
This home is located at 3408 Trillium Ct, Westfield, IN 46074 and is currently estimated at $340,844, approximately $178 per square foot. 3408 Trillium Ct is a home located in Hamilton County with nearby schools including Washington Woods Elementary School, Westfield Intermediate School, and Westfield Middle School.
Ownership History
Date
Name
Owned For
Owner Type
Purchase Details
Closed on
Oct 6, 2021
Sold by
M I Homes Of Indiana Lp
Bought by
Evans Charles and Evans Sarah
Current Estimated Value
Home Financials for this Owner
Home Financials are based on the most recent Mortgage that was taken out on this home.
Original Mortgage
$182,000
Outstanding Balance
$165,967
Interest Rate
2.8%
Mortgage Type
New Conventional
Estimated Equity
$174,877
Purchase Details
Closed on
May 7, 2013
Sold by
Evans Ryan Wayne and Evans Ryan W
Bought by
Lawhorn Evans April and Evans April D
Purchase Details
Closed on
Jun 26, 2006
Sold by
Hatch Kevin and Hatch Deanna
Bought by
Evans Ryan W and Evans April D
Home Financials for this Owner
Home Financials are based on the most recent Mortgage that was taken out on this home.
Original Mortgage
$134,100
Interest Rate
10.15%
Mortgage Type
Balloon
Create a Home Valuation Report for This Property
The Home Valuation Report is an in-depth analysis detailing your home's value as well as a comparison with similar homes in the area
Home Values in the Area
Average Home Value in this Area
Purchase History
| Date | Buyer | Sale Price | Title Company |
|---|---|---|---|
| Evans Charles | -- | Transohio Res Ttl Agcy Ltd | |
| Lawhorn Evans April | -- | None Available | |
| Evans Ryan W | -- | None Available |
Source: Public Records
Mortgage History
| Date | Status | Borrower | Loan Amount |
|---|---|---|---|
| Open | Evans Charles | $182,000 | |
| Previous Owner | Evans Ryan W | $134,100 |
Source: Public Records
Tax History Compared to Growth
Tax History
| Year | Tax Paid | Tax Assessment Tax Assessment Total Assessment is a certain percentage of the fair market value that is determined by local assessors to be the total taxable value of land and additions on the property. | Land | Improvement |
|---|---|---|---|---|
| 2024 | $2,787 | $266,900 | $49,800 | $217,100 |
| 2023 | $2,812 | $246,900 | $49,800 | $197,100 |
| 2022 | $2,530 | $217,900 | $49,800 | $168,100 |
| 2021 | $2,452 | $208,100 | $49,800 | $158,300 |
| 2020 | $2,214 | $187,100 | $49,800 | $137,300 |
| 2019 | $2,075 | $176,000 | $34,400 | $141,600 |
| 2018 | $1,946 | $163,400 | $34,400 | $129,000 |
| 2017 | $1,768 | $158,500 | $34,400 | $124,100 |
| 2016 | $1,619 | $145,100 | $34,400 | $110,700 |
| 2014 | $1,459 | $131,700 | $34,400 | $97,300 |
| 2013 | $1,459 | $130,800 | $34,400 | $96,400 |
Source: Public Records
Map
Nearby Homes
- 3340 Redbud Ct
- 18331 Lakes End Ct
- 18153 Birdview Ct
- 17665 Shaelynn Ct
- 3965 Idlewind Dr
- 18426 Edinbrook Ln
- 4247 Pearson Dr
- 4024 Storrow Way
- 4006 Westfield Rd
- 801 Birch St
- 3923 Holly Brook Dr
- 3536 Tolworth Ln
- 3866 Holly Brook Dr
- 3866 Holly Brook Dr
- 3890 Holly Brook Dr
- 3890 Holly Brook Dr
- 3898 Holly Brook Dr
- 3898 Holly Brook Dr
- 3914 Holly Brook Dr
- 3914 Holly Brook Dr
- 3416 Trillium Ct
- 3405 Crocus Ct
- 18058 Grassy Knoll Dr
- 18066 Grassy Knoll Dr
- 3411 Crocus Ct
- 3407 Trillium Ct
- 3401 Trillium Ct
- 3415 Trillium Ct
- 18050 Grassy Knoll Dr
- 18051 Grassy Knoll Dr
- 18074 Grassy Knoll Dr
- 3436 Trillium Ct
- 3423 Trillium Ct
- 3421 Crocus Ct
- 18043 Grassy Knoll Dr
- 18032 Grassy Knoll Dr
- 3431 Trillium Ct
- 18082 Grassy Knoll Dr
- 3310 Redbud Ct
- 3440 Trillium Ct