Estimated Value: $349,000 - $425,000
Studio
2
Baths
2,732
Sq Ft
$142/Sq Ft
Est. Value
About This Home
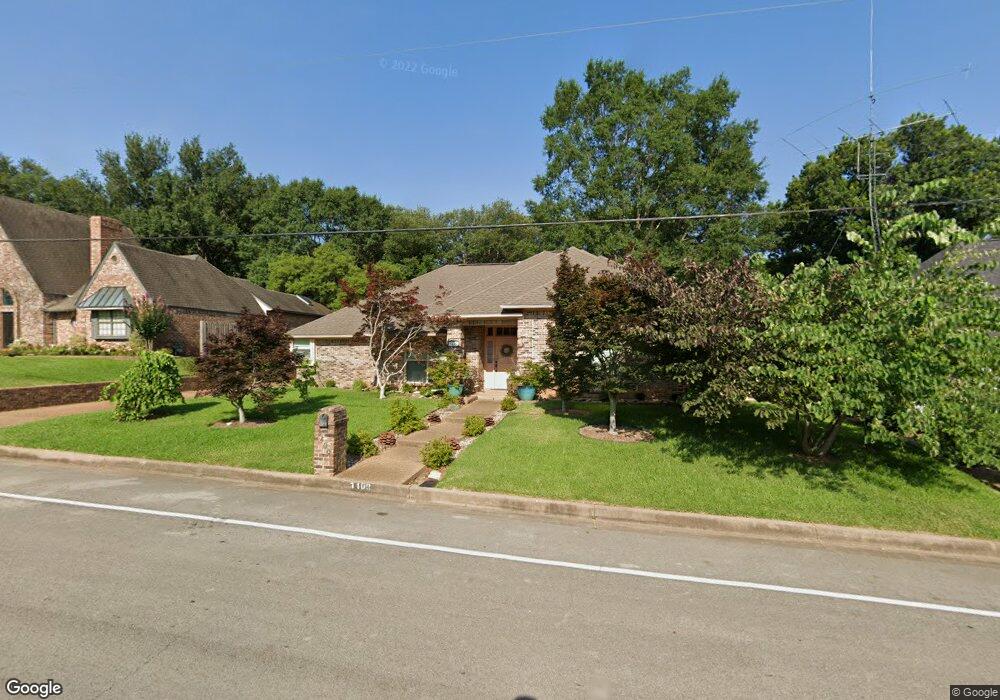
This home is located at 3409 Brookside Dr, Tyler, TX 75701 and is currently estimated at $388,891, approximately $142 per square foot. 3409 Brookside Dr is a home located in Smith County with nearby schools including Woods Elementary School, Hubbard Middle School, and Tyler Legacy High School.
Create a Home Valuation Report for This Property
The Home Valuation Report is an in-depth analysis detailing your home's value as well as a comparison with similar homes in the area
Tax History
| Year | Tax Paid | Tax Assessment Tax Assessment Total Assessment is a certain percentage of the fair market value that is determined by local assessors to be the total taxable value of land and additions on the property. | Land | Improvement |
|---|---|---|---|---|
| 2025 | $2,010 | $424,105 | $77,582 | $346,523 |
| 2024 | $2,010 | $291,992 | $25,830 | $368,507 |
| 2023 | $4,627 | $360,932 | $25,830 | $335,102 |
| 2022 | $4,728 | $338,160 | $25,830 | $312,330 |
| 2021 | $4,603 | $219,377 | $25,830 | $193,547 |
| 2020 | $4,625 | $216,125 | $25,830 | $190,295 |
| 2019 | $4,691 | $214,507 | $25,830 | $188,677 |
| 2018 | $4,490 | $206,435 | $25,830 | $180,605 |
| 2017 | $4,407 | $206,435 | $25,830 | $180,605 |
| 2016 | $4,321 | $202,382 | $25,830 | $176,552 |
| 2015 | $3,567 | $201,026 | $25,830 | $175,196 |
| 2014 | $3,567 | $198,091 | $25,830 | $172,261 |
Source: Public Records
Map
Nearby Homes
- 3308 Trafalgar Square
- 640 Beechwood Dr
- 612 Rosemont Place II
- 507 Hyde Park Dr
- 504 Hyde Park Dr
- 3500 Silverwood Dr
- 509 Buckingham Place
- 3501 Silverwood Dr
- 505 Buckingham Place
- 614 Zelwood Dr
- 1111 Beechwood Dr
- 736 Fairmont Dr
- 604-606 Woodland Hills Dr
- 3518 Cloverdale Dr
- 3613 Silverwood Dr
- 745 Fairmont Dr
- 504 Woodland Hills Dr
- 3048 Concord Place
- 1211 Brookshire Dr
- 3045 Concord Place
- 3407 Brookside Dr
- 3411 Brookside Dr
- 3410 Teakwood Dr
- 3408 Teakwood Dr
- 3412 Teakwood Dr
- 3412 3412 Teakwood Dr
- 638 Sherry Ln
- 3405 Brookside Dr
- 3413 Brookside Dr
- 601 Rosemont Place
- 3406 Teakwood Dr
- 3423 Harwood Dr
- 3403 Brookside Dr
- 630 Sherry Ln
- 3416 Brookside Dr
- 701 Gabriel Dr
- 603 603 Rosemont Place
- 3404 Teakwood Dr
- 603 Rosemont Place
- 3411 3411 Teakwood
Your Personal Tour Guide
Ask me questions while you tour the home.