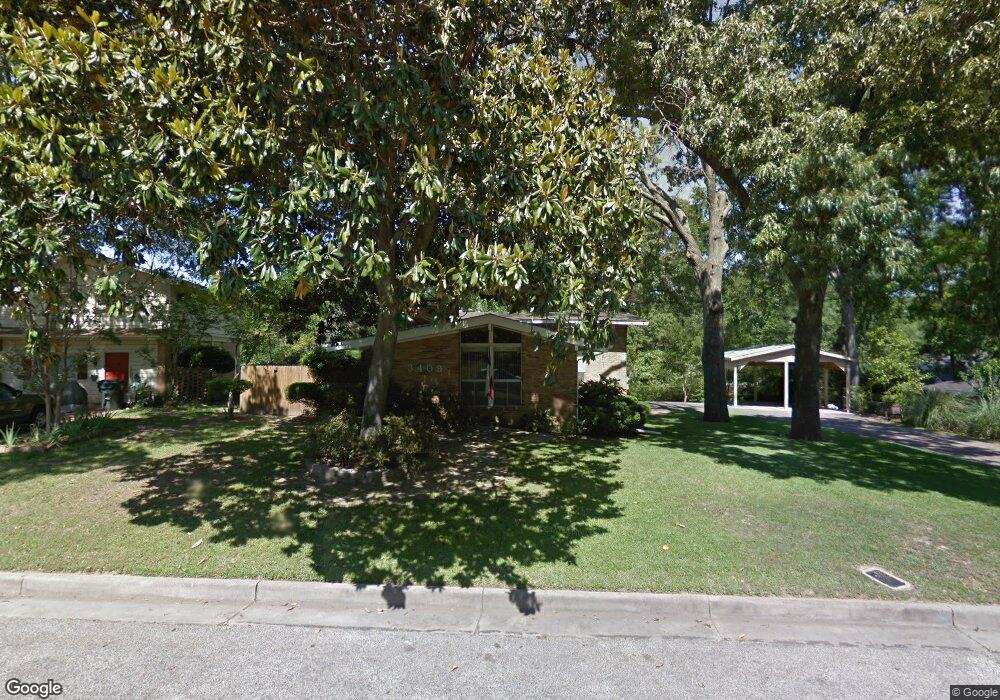
3409 Mcmillan Dr Tyler, TX 75701
Green Acres NeighborhoodEstimated Value: $239,000 - $324,000
--
Bed
3
Baths
1,352
Sq Ft
$212/Sq Ft
Est. Value
About This Home
This home is located at 3409 Mcmillan Dr, Tyler, TX 75701 and is currently estimated at $287,188, approximately $212 per square foot. 3409 Mcmillan Dr is a home located in Smith County with nearby schools including Woods Elementary School, Hubbard Middle School, and Tyler Legacy High School.
Ownership History
Date
Name
Owned For
Owner Type
Purchase Details
Closed on
Mar 22, 2016
Sold by
Thompson Douglas Browning and Thompson Tamara Jacqueline
Bought by
Mckellar Vanessa J and Mckellar Jerry B
Current Estimated Value
Home Financials for this Owner
Home Financials are based on the most recent Mortgage that was taken out on this home.
Original Mortgage
$171,000
Outstanding Balance
$134,975
Interest Rate
3.65%
Mortgage Type
New Conventional
Estimated Equity
$152,213
Purchase Details
Closed on
Apr 17, 2009
Sold by
Thompson Paul M and Thompson Deborah A
Bought by
Thompson Douglas B
Purchase Details
Closed on
Oct 24, 2006
Sold by
Smith Joe A and Smith Cleo M
Bought by
Thompson Paul M and Thompson Douglas B
Home Financials for this Owner
Home Financials are based on the most recent Mortgage that was taken out on this home.
Original Mortgage
$96,000
Interest Rate
6%
Mortgage Type
Purchase Money Mortgage
Create a Home Valuation Report for This Property
The Home Valuation Report is an in-depth analysis detailing your home's value as well as a comparison with similar homes in the area
Home Values in the Area
Average Home Value in this Area
Purchase History
| Date | Buyer | Sale Price | Title Company |
|---|---|---|---|
| Mckellar Vanessa J | -- | None Available | |
| Thompson Douglas B | -- | Central Title Company | |
| Thompson Douglas B | -- | Central Title Company | |
| Thompson Paul M | -- | None Available |
Source: Public Records
Mortgage History
| Date | Status | Borrower | Loan Amount |
|---|---|---|---|
| Open | Mckellar Vanessa J | $171,000 | |
| Previous Owner | Thompson Paul M | $96,000 | |
| Closed | Thompson Douglas B | $0 |
Source: Public Records
Tax History Compared to Growth
Tax History
| Year | Tax Paid | Tax Assessment Tax Assessment Total Assessment is a certain percentage of the fair market value that is determined by local assessors to be the total taxable value of land and additions on the property. | Land | Improvement |
|---|---|---|---|---|
| 2025 | $2,994 | $235,503 | $51,120 | $184,383 |
| 2024 | $2,994 | $232,772 | $39,300 | $193,472 |
| 2023 | $4,191 | $275,089 | $39,300 | $235,789 |
| 2022 | $4,282 | $218,560 | $32,751 | $185,809 |
| 2021 | $4,303 | $205,119 | $32,751 | $172,368 |
| 2020 | $4,313 | $201,552 | $32,751 | $168,801 |
| 2019 | $4,109 | $187,931 | $26,200 | $161,731 |
| 2018 | $4,019 | $184,795 | $26,200 | $158,595 |
| 2017 | $4,018 | $188,196 | $26,200 | $161,996 |
| 2016 | $2,740 | $128,331 | $26,200 | $102,131 |
| 2015 | $2,452 | $129,392 | $26,200 | $103,192 |
| 2014 | $2,452 | $126,412 | $26,200 | $100,212 |
Source: Public Records
Map
Nearby Homes
- 3400 Birdwell Dr
- 1505 Glenrose St
- 3235 Curtis Dr
- 1408 Westfield St
- 3215 Curtis Dr
- 3110 Curtis Dr
- 2938 Dinah Ln
- 3523 S Cameron Ave
- 1602 Dennis Dr
- 3008 Oak Knob Dr
- 2929 Dinah Ln
- 1113 E Amherst Dr
- 3024 Royal Garden Rd
- 2918 Oak Knob St
- 4211 Birdwell Dr
- 1720 Kimwood Ln
- 2820 Oak Knob St
- 1807 Kimwood Ln
- 3006 de Charles St
- 2006 Villa Dr
- 3409 3409 McMillan
- 3401 Mcmillan Dr
- 3417 Mcmillan Dr
- 3400 Woodbine Blvd
- 3400 3400 Woodbine
- 1800 Blossom Ln
- 3331 Mcmillan Dr
- 3416 Woodbine Blvd
- 3336 Dinah Ln
- 3501 Mcmillan Dr
- 1801 Blossom Ln
- 1801 1801 Blossom
- 3330 Mcmillan Dr
- 1808 Blossom Ln
- 1808 1808 Blossom
- 3325 Mcmillan Dr
- 3504 Woodbine Blvd
- 3504 3504 Woodbine
- 3325 3325 McMillan
- 3325 3325 McMillan