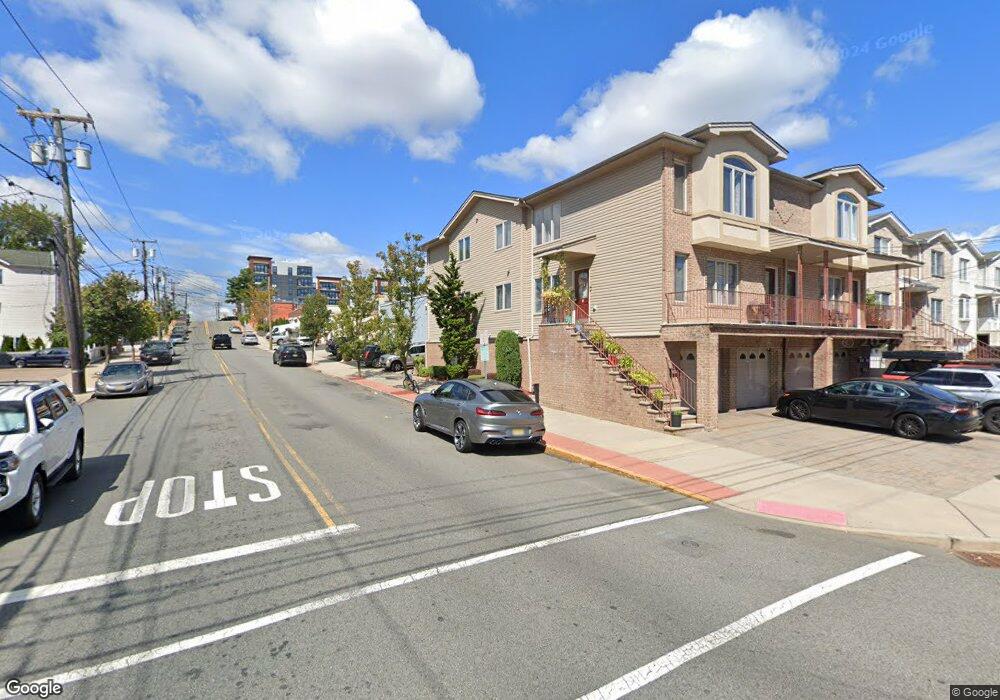
341 9th St Unit C Fairview, NJ 07022
Estimated Value: $478,000 - $545,661
3
Beds
2
Baths
1,364
Sq Ft
$376/Sq Ft
Est. Value
About This Home
This home is located at 341 9th St Unit C, Fairview, NJ 07022 and is currently estimated at $512,665, approximately $375 per square foot. 341 9th St Unit C is a home located in Bergen County with nearby schools including The Annex Elementary School, Number Three School, and Lincoln Elementary School.
Ownership History
Date
Name
Owned For
Owner Type
Purchase Details
Closed on
Sep 16, 2021
Sold by
Kim Sunglae and Kim June Woo
Bought by
Umbach Kaila L and Gares Manuel Felix
Current Estimated Value
Home Financials for this Owner
Home Financials are based on the most recent Mortgage that was taken out on this home.
Original Mortgage
$370,000
Interest Rate
2.88%
Mortgage Type
New Conventional
Purchase Details
Closed on
Mar 1, 2018
Sold by
Bc 3419Th Strret Llc
Bought by
Kim Singlae and Kim Junewoo
Purchase Details
Closed on
Sep 18, 2014
Sold by
Spiliotes James
Bought by
Bc 341 9Th Street Llc
Home Financials for this Owner
Home Financials are based on the most recent Mortgage that was taken out on this home.
Original Mortgage
$350,000
Interest Rate
5%
Mortgage Type
Purchase Money Mortgage
Purchase Details
Closed on
Apr 9, 2007
Sold by
Warjoe Llc
Bought by
Spiliotes James and Spiliotes Jaime
Create a Home Valuation Report for This Property
The Home Valuation Report is an in-depth analysis detailing your home's value as well as a comparison with similar homes in the area
Home Values in the Area
Average Home Value in this Area
Purchase History
| Date | Buyer | Sale Price | Title Company |
|---|---|---|---|
| Umbach Kaila L | $390,000 | Old Republic Title | |
| Umbach Kaila L | $390,000 | Old Republic Title | |
| Kim Singlae | $340,000 | -- | |
| Bc 341 9Th Street Llc | $175,000 | -- | |
| Spiliotes James | $375,000 | -- |
Source: Public Records
Mortgage History
| Date | Status | Borrower | Loan Amount |
|---|---|---|---|
| Previous Owner | Umbach Kaila L | $370,000 | |
| Previous Owner | Bc 341 9Th Street Llc | $350,000 |
Source: Public Records
Tax History
| Year | Tax Paid | Tax Assessment Tax Assessment Total Assessment is a certain percentage of the fair market value that is determined by local assessors to be the total taxable value of land and additions on the property. | Land | Improvement |
|---|---|---|---|---|
| 2025 | $8,334 | $367,400 | $83,000 | $284,400 |
| 2024 | $7,891 | $360,300 | $80,500 | $279,800 |
| 2023 | $7,775 | $349,000 | $78,500 | $270,500 |
| 2022 | $7,775 | $334,400 | $75,000 | $259,400 |
| 2021 | $7,338 | $296,000 | $47,500 | $248,500 |
| 2020 | $7,497 | $289,800 | $45,000 | $244,800 |
| 2019 | $8,632 | $257,200 | $35,000 | $222,200 |
| 2018 | $8,657 | $257,200 | $35,000 | $222,200 |
| 2017 | $8,385 | $257,200 | $35,000 | $222,200 |
| 2016 | $7,924 | $257,200 | $35,000 | $222,200 |
| 2015 | $7,508 | $257,200 | $35,000 | $222,200 |
| 2014 | $7,340 | $257,200 | $35,000 | $222,200 |
Source: Public Records
Map
Nearby Homes
- 439 Cliff St
- 440 Morningside Ave Unit B
- 412 Walker St
- 234 6th St
- 398 Cliff St
- 233 5th St Unit B
- 423 N 8th St
- 220 5th St
- 373 Jersey Ave
- 386A Park Ave Unit A
- 439 N 8th St
- 385A Roosevelt St
- 615 Prospect Ave Unit B
- 615B Prospect Ave
- 174 Maple St
- 577 Fairview Ave
- 3 Linda Ln
- 698 Fairview Ave
- 309 2nd St
- 373 Mckinley St
- 341 9th St Unit D
- 341 9th St Unit B
- 341 9th St Unit A
- 341 9th St
- 343A 9th St
- 343A 9th St Unit A
- 343B 9th St
- 343 9th St Unit A
- 343 9th St
- 470 Cliff St
- 345A 9th St
- 345A 9th St Unit A
- 472B Cliff St
- 323 9th St
- 472A Cliff St
- 478 Cliff St Unit A
- 478 Cliff St Unit 478 A
- 345B 9th St
- 478B Cliff St
- 320 9th St
Your Personal Tour Guide
Ask me questions while you tour the home.