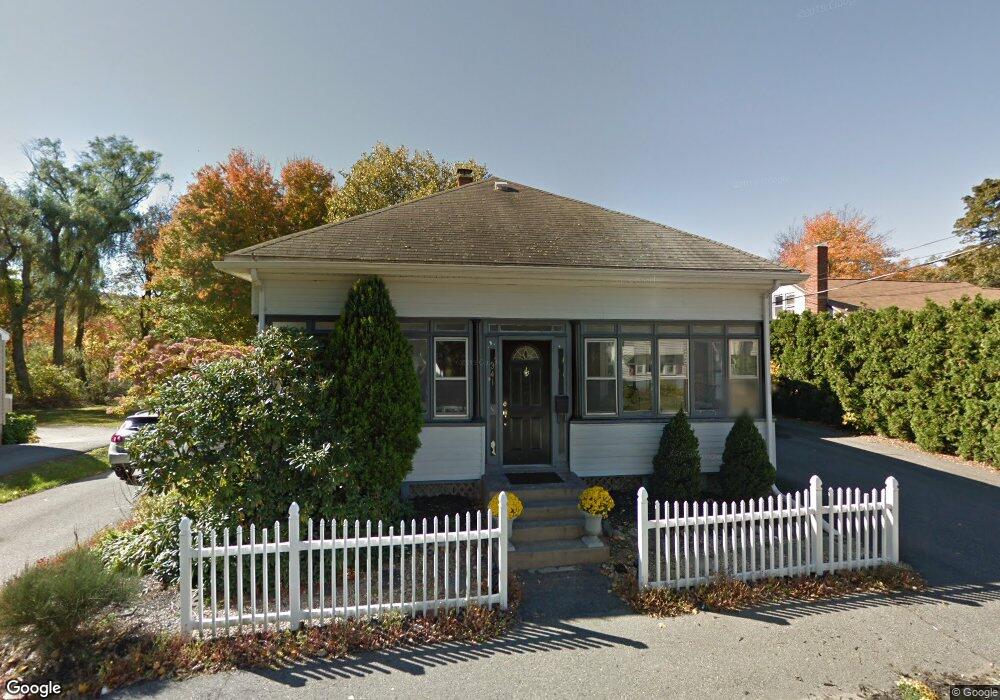
341 Ash St Reading, MA 01867
Estimated Value: $699,000 - $801,000
3
Beds
2
Baths
1,297
Sq Ft
$585/Sq Ft
Est. Value
About This Home
This home is located at 341 Ash St, Reading, MA 01867 and is currently estimated at $758,455, approximately $584 per square foot. 341 Ash St is a home located in Middlesex County with nearby schools including J. Warren Killam Elementary School, Walter S. Parker Middle School, and Reading Memorial High School.
Ownership History
Date
Name
Owned For
Owner Type
Purchase Details
Closed on
Jul 29, 2005
Sold by
Forge Michael J and Forge Rebecca A
Bought by
Stone Kerri A
Current Estimated Value
Home Financials for this Owner
Home Financials are based on the most recent Mortgage that was taken out on this home.
Original Mortgage
$282,450
Interest Rate
5.67%
Mortgage Type
Purchase Money Mortgage
Purchase Details
Closed on
Jul 21, 1998
Sold by
Robinson Karen M
Bought by
Gallant Rebecca A
Purchase Details
Closed on
Nov 30, 1995
Sold by
Kurkjian Mark and Kurkjian Diane R
Bought by
Gallant Rebecca A and Robinson Karen M
Home Financials for this Owner
Home Financials are based on the most recent Mortgage that was taken out on this home.
Original Mortgage
$130,500
Interest Rate
7.37%
Mortgage Type
Purchase Money Mortgage
Create a Home Valuation Report for This Property
The Home Valuation Report is an in-depth analysis detailing your home's value as well as a comparison with similar homes in the area
Home Values in the Area
Average Home Value in this Area
Purchase History
| Date | Buyer | Sale Price | Title Company |
|---|---|---|---|
| Stone Kerri A | $372,450 | -- | |
| Gallant Rebecca A | $9,000 | -- | |
| Gallant Rebecca A | $145,000 | -- |
Source: Public Records
Mortgage History
| Date | Status | Borrower | Loan Amount |
|---|---|---|---|
| Open | Gallant Rebecca A | $259,000 | |
| Closed | Gallant Rebecca A | $268,600 | |
| Closed | Stone Kerri A | $282,450 | |
| Previous Owner | Gallant Rebecca A | $130,500 |
Source: Public Records
Tax History
| Year | Tax Paid | Tax Assessment Tax Assessment Total Assessment is a certain percentage of the fair market value that is determined by local assessors to be the total taxable value of land and additions on the property. | Land | Improvement |
|---|---|---|---|---|
| 2025 | $8,326 | $731,000 | $473,200 | $257,800 |
| 2024 | $8,231 | $702,300 | $454,600 | $247,700 |
| 2023 | $7,972 | $633,200 | $409,900 | $223,300 |
| 2022 | $7,673 | $575,600 | $372,600 | $203,000 |
| 2021 | $7,423 | $537,500 | $352,200 | $185,300 |
| 2020 | $7,255 | $520,100 | $340,800 | $179,300 |
| 2019 | $7,027 | $493,800 | $323,600 | $170,200 |
| 2018 | $6,273 | $452,300 | $296,400 | $155,900 |
| 2017 | $6,131 | $437,000 | $286,400 | $150,600 |
| 2016 | $5,655 | $390,000 | $246,600 | $143,400 |
| 2015 | $5,460 | $371,400 | $234,800 | $136,600 |
| 2014 | $5,215 | $353,800 | $223,700 | $130,100 |
Source: Public Records
Map
Nearby Homes
- 241 Main St Unit C3
- 20 Pinevale Ave
- 1 Summit Dr Unit 57
- 1014 Gazebo Cir Unit 1014
- 311 Gazebo Cir Unit 311
- 75 Hopkins St
- 90 Sunnyside Ave
- 1 Pennsylvania Ave
- 48 Village St Unit 1001
- 50 Quannapowitt Pkwy
- 313 South St
- 95 Prospect St
- 75 Augustus Ct Unit 2003
- 4 Adams St
- 5 Washington St Unit D4
- 5 Washington St Unit A5
- 133 Pine Ridge Rd
- 64 Main St Unit 24B
- 12 Isola Ln
- 66 Main St Unit 16A
Your Personal Tour Guide
Ask me questions while you tour the home.