Estimated Value: $1,393,000 - $1,452,000
4
Beds
5
Baths
4,080
Sq Ft
$350/Sq Ft
Est. Value
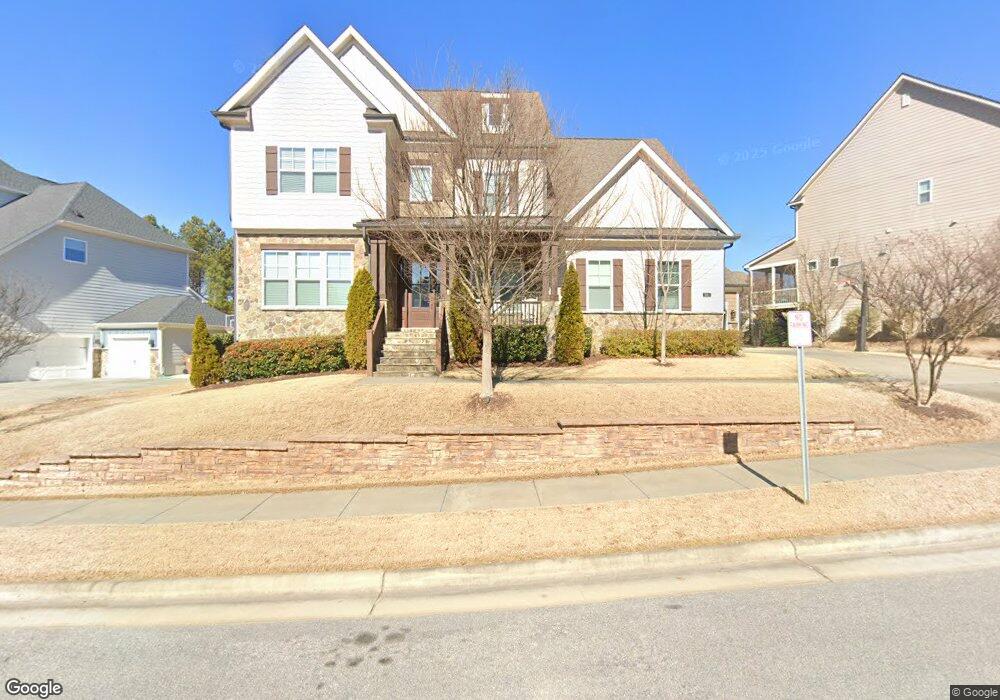
About This Home
This home is located at 341 Bolton Grant Dr Unit 13, Cary, NC 27519 and is currently estimated at $1,429,408, approximately $350 per square foot. 341 Bolton Grant Dr Unit 13 is a home located in Wake County with nearby schools including Hortons Creek Elementary, Mills Park Middle School, and Panther Creek High School.
Ownership History
Date
Name
Owned For
Owner Type
Purchase Details
Closed on
Mar 16, 2023
Sold by
Riley Deana
Bought by
Preeti H Parekh Living Trust
Current Estimated Value
Home Financials for this Owner
Home Financials are based on the most recent Mortgage that was taken out on this home.
Original Mortgage
$750,000
Outstanding Balance
$727,247
Interest Rate
6.32%
Mortgage Type
New Conventional
Estimated Equity
$702,161
Purchase Details
Closed on
Aug 20, 2021
Sold by
Mcguire Brian
Bought by
Riley Ileana and Mcguire Brian
Purchase Details
Closed on
Aug 13, 2021
Sold by
Riley Ileana
Bought by
Mcguire Brian
Purchase Details
Closed on
May 16, 2016
Sold by
Ashton Raleigh Residential Llc
Bought by
Riley Ileana
Home Financials for this Owner
Home Financials are based on the most recent Mortgage that was taken out on this home.
Original Mortgage
$417,000
Interest Rate
3.59%
Mortgage Type
New Conventional
Create a Home Valuation Report for This Property
The Home Valuation Report is an in-depth analysis detailing your home's value as well as a comparison with similar homes in the area
Home Values in the Area
Average Home Value in this Area
Purchase History
| Date | Buyer | Sale Price | Title Company |
|---|---|---|---|
| Preeti H Parekh Living Trust | $1,385,000 | -- | |
| Riley Ileana | -- | None Available | |
| Mcguire Brian | -- | None Available | |
| Riley Ileana | $646,000 | None Available |
Source: Public Records
Mortgage History
| Date | Status | Borrower | Loan Amount |
|---|---|---|---|
| Open | Preeti H Parekh Living Trust | $750,000 | |
| Previous Owner | Riley Ileana | $417,000 |
Source: Public Records
Tax History Compared to Growth
Tax History
| Year | Tax Paid | Tax Assessment Tax Assessment Total Assessment is a certain percentage of the fair market value that is determined by local assessors to be the total taxable value of land and additions on the property. | Land | Improvement |
|---|---|---|---|---|
| 2025 | $10,864 | $1,265,254 | $280,000 | $985,254 |
| 2024 | $10,629 | $1,265,254 | $280,000 | $985,254 |
| 2023 | $6,767 | $673,342 | $124,000 | $549,342 |
| 2022 | $6,514 | $673,342 | $124,000 | $549,342 |
| 2021 | $6,383 | $673,342 | $124,000 | $549,342 |
| 2020 | $6,417 | $673,342 | $124,000 | $549,342 |
| 2019 | $6,763 | $629,740 | $124,000 | $505,740 |
| 2018 | $6,345 | $629,740 | $124,000 | $505,740 |
| 2017 | $6,097 | $621,463 | $124,000 | $497,463 |
| 2016 | $1,243 | $130,800 | $124,000 | $6,800 |
Source: Public Records
Map
Nearby Homes
- 541 Weycroft Grant Dr
- 3825 Cary Glen Blvd
- 202 Dove Cottage Ln
- 128 Dove Cottage Ln
- 5030 Myrtle Oak Dr
- 235 Michigan Ave
- 1014 Summerhouse Rd
- 254 Michigan Ave
- 2001 Summerhouse Rd
- 5023 Lalex Ln
- 3000 Summerhouse Rd
- 518 Foxdale Ridge Dr
- 817 Nijinski Way
- 518 Emerald Downs Rd
- 1121 Brookhill Way
- 305 Village Orchard Rd
- 4107 Bluff Oak Dr
- 111 Woodland Ridge Ct
- 600 Hedrick Ridge Rd Unit 312
- 600 Hedrick Ridge Rd Unit 306
- 341 Bolton Grant Dr
- 337 Bolton Grant Dr
- 337 Bolton Grant Dr Unit 12
- 345 Bolton Grant Dr
- 340 Bolton Grant Dr
- 340 Bolton Grant Dr Unit 8
- 540 Bolton Grant Dr
- 349 Bolton Grant Dr
- 544 Bolton Grant Dr
- 325 Bolton Grant Dr Unit 87
- 325 Bolton Grant Dr
- 905 Ferrymeade Ct Unit 9
- 357 Bolton Grant Dr
- 348 Bolton Grant Dr
- 909 Ferry Meade Ct
- 321 Bolton Grant Dr
- 1120 Weycroft Ridge Dr
- 1120 Weycroft Ridge Dr Unit L86
- 908 Ferrymeade Ct
- 908 Ferrymeade Ct Unit Lot 11