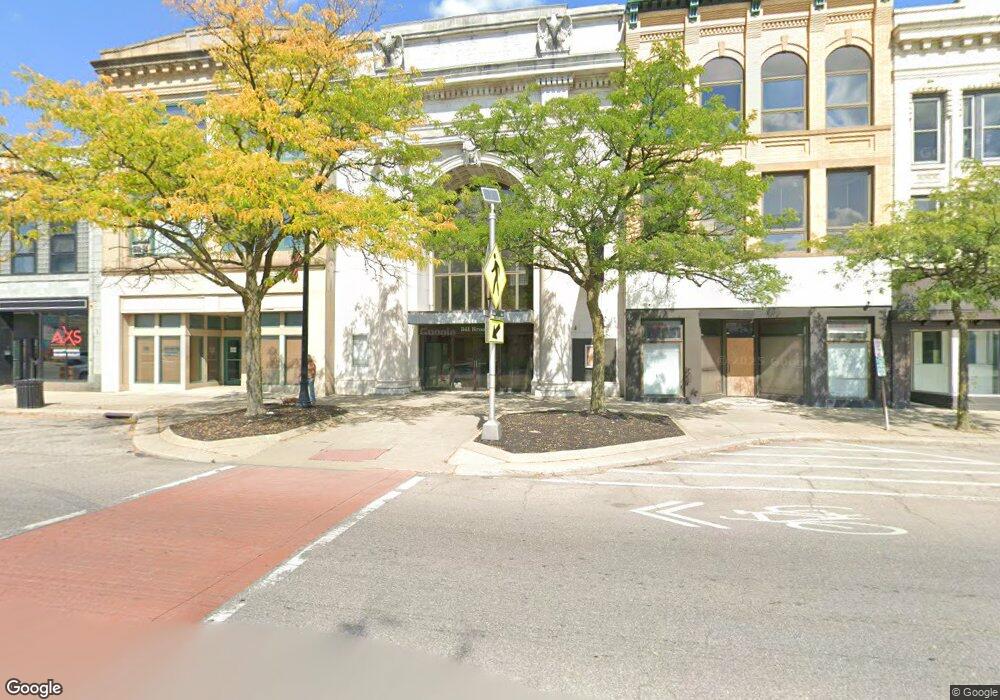
341 Broad St Elyria, OH 44035
Estimated Value: $250,775
Studio
--
Bath
5,048
Sq Ft
$50/Sq Ft
Est. Value
About This Home
This home is located at 341 Broad St, Elyria, OH 44035 and is currently estimated at $250,775, approximately $49 per square foot. 341 Broad St is a home located in Lorain County with nearby schools including Eastern Heights Middle School, Elyria High School, and Constellation Schools: Elyria Community Elementary.
Ownership History
Date
Name
Owned For
Owner Type
Purchase Details
Closed on
Sep 27, 2019
Sold by
Jgt Group Llc
Bought by
550 Broadway Llc
Current Estimated Value
Purchase Details
Closed on
Dec 1, 2016
Sold by
Jgt Enterprises Inc
Bought by
Jgt Group Llc
Purchase Details
Closed on
Nov 16, 1999
Sold by
National City Bank
Bought by
Jgt Enterprises Inc
Home Financials for this Owner
Home Financials are based on the most recent Mortgage that was taken out on this home.
Original Mortgage
$1,409,255
Interest Rate
8.02%
Mortgage Type
Commercial
Create a Home Valuation Report for This Property
The Home Valuation Report is an in-depth analysis detailing your home's value as well as a comparison with similar homes in the area
Home Values in the Area
Average Home Value in this Area
Purchase History
| Date | Buyer | Sale Price | Title Company |
|---|---|---|---|
| 550 Broadway Llc | $141,900 | None Available | |
| Jgt Group Llc | -- | Fidelity National Title | |
| Jgt Enterprises Inc | $145,000 | Surety Title Agency Inc |
Source: Public Records
Mortgage History
| Date | Status | Borrower | Loan Amount |
|---|---|---|---|
| Previous Owner | Jgt Enterprises Inc | $1,409,255 |
Source: Public Records
Tax History
| Year | Tax Paid | Tax Assessment Tax Assessment Total Assessment is a certain percentage of the fair market value that is determined by local assessors to be the total taxable value of land and additions on the property. | Land | Improvement |
|---|---|---|---|---|
| 2024 | $3,097 | $51,531 | $9,310 | $42,221 |
| 2023 | $3,611 | $49,665 | $9,310 | $40,355 |
| 2022 | $3,592 | $49,665 | $9,310 | $40,355 |
| 2021 | $6,358 | $87,164 | $9,310 | $77,854 |
| 2020 | $6,610 | $87,160 | $9,310 | $77,850 |
| 2019 | $6,544 | $87,160 | $9,310 | $77,850 |
| 2018 | $5,050 | $87,160 | $9,310 | $77,850 |
| 2017 | $3,627 | $45,880 | $9,930 | $35,950 |
| 2016 | $3,572 | $45,880 | $9,930 | $35,950 |
| 2015 | $3,364 | $45,880 | $9,930 | $35,950 |
| 2014 | $3,317 | $45,880 | $9,930 | $35,950 |
| 2013 | $3,260 | $45,880 | $9,930 | $35,950 |
Source: Public Records
Map
Nearby Homes
Your Personal Tour Guide
Ask me questions while you tour the home.