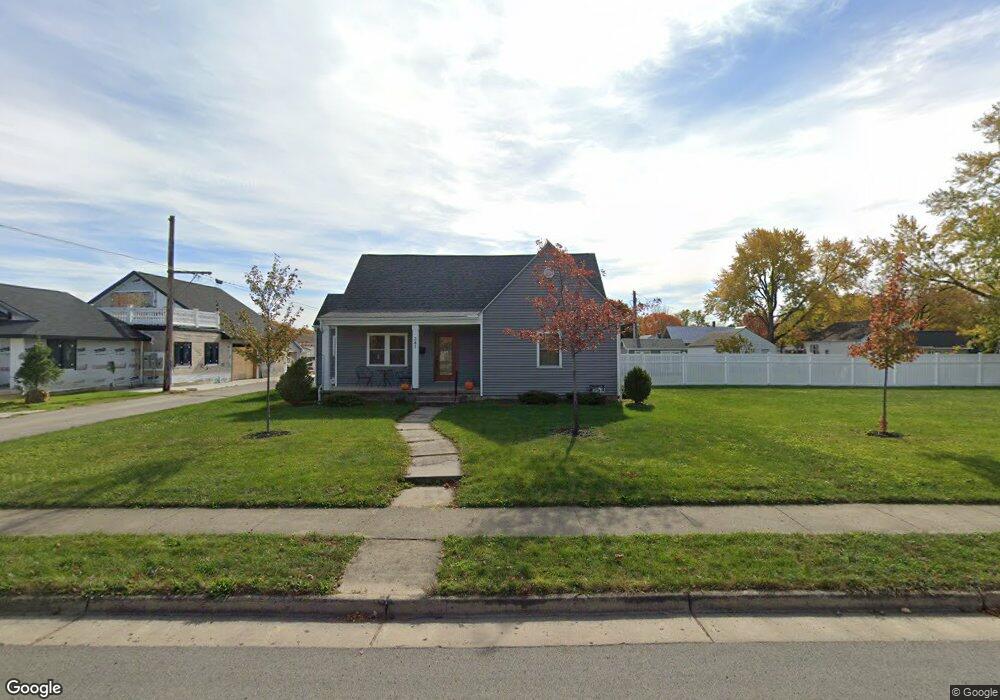
341 E 4th St Minster, OH 45865
Estimated Value: $236,962 - $350,000
3
Beds
2
Baths
2,337
Sq Ft
$130/Sq Ft
Est. Value
About This Home
This home is located at 341 E 4th St, Minster, OH 45865 and is currently estimated at $302,741, approximately $129 per square foot. 341 E 4th St is a home located in Auglaize County with nearby schools including Minster Elementary School and Minster Junior/Senior High School.
Ownership History
Date
Name
Owned For
Owner Type
Purchase Details
Closed on
Dec 23, 2020
Sold by
Bihn Mitchell R and Bihn Hanna
Bought by
Bihn Mitchell R and Bihn Hanna
Current Estimated Value
Home Financials for this Owner
Home Financials are based on the most recent Mortgage that was taken out on this home.
Original Mortgage
$200,000
Outstanding Balance
$176,825
Interest Rate
2.7%
Mortgage Type
Closed End Mortgage
Estimated Equity
$125,916
Purchase Details
Closed on
Aug 26, 2011
Sold by
For Enterprises Llc
Bought by
Bihn Mitchell R
Home Financials for this Owner
Home Financials are based on the most recent Mortgage that was taken out on this home.
Original Mortgage
$120,000
Interest Rate
4.58%
Mortgage Type
New Conventional
Purchase Details
Closed on
Jan 18, 2001
Sold by
Murtz Lawrence J
Bought by
Kritner Russell C
Purchase Details
Closed on
May 1, 1988
Create a Home Valuation Report for This Property
The Home Valuation Report is an in-depth analysis detailing your home's value as well as a comparison with similar homes in the area
Home Values in the Area
Average Home Value in this Area
Purchase History
| Date | Buyer | Sale Price | Title Company |
|---|---|---|---|
| Bihn Mitchell R | -- | None Available | |
| Bihn Mitchell R | $127,000 | None Available | |
| Kritner Russell C | $67,500 | -- | |
| -- | $62,000 | -- |
Source: Public Records
Mortgage History
| Date | Status | Borrower | Loan Amount |
|---|---|---|---|
| Open | Bihn Mitchell R | $200,000 | |
| Closed | Bihn Mitchell R | $120,000 |
Source: Public Records
Tax History
| Year | Tax Paid | Tax Assessment Tax Assessment Total Assessment is a certain percentage of the fair market value that is determined by local assessors to be the total taxable value of land and additions on the property. | Land | Improvement |
|---|---|---|---|---|
| 2025 | $4,177 | $60,120 | $8,960 | $51,160 |
| 2024 | $4,177 | $60,120 | $8,960 | $51,160 |
| 2023 | $2,042 | $60,120 | $8,960 | $51,160 |
| 2022 | $1,988 | $54,290 | $8,220 | $46,070 |
| 2021 | $2,027 | $54,290 | $8,220 | $46,070 |
| 2020 | $1,044 | $54,293 | $8,222 | $46,071 |
| 2019 | $1,825 | $44,611 | $6,755 | $37,856 |
| 2018 | $1,569 | $38,276 | $6,755 | $31,521 |
| 2017 | $1,456 | $38,276 | $6,755 | $31,521 |
| 2016 | $1,315 | $33,762 | $6,129 | $27,633 |
| 2015 | $1,293 | $33,762 | $6,129 | $27,633 |
| 2014 | $1,294 | $33,762 | $6,129 | $27,633 |
| 2013 | $1,357 | $33,762 | $6,129 | $27,633 |
Source: Public Records
Map
Nearby Homes
- 31 Melcher St
- 7 E 2nd St
- 17 Stonegate Dr
- 0 Stonegate Dr Unit 14 10544847
- 0 Stonegate Dr Unit 21 10544857
- 36 Shania Place Unit 23
- 28 Shania Place Unit 33
- 19 Shania Place Unit 33
- 27 Shania Place Unit 26
- 5761 Fisher & Koverman Rd
- 561 S Walnut St Unit Lot3
- 1991 Minster Egypt Pike
- 12299 Short Dr
- 315 Mid Lane St
- 130 Janice Dr
- 137 Janice Dr
- 141 Janice Dr
- 145 Janice Dr
- 149 Janice Dr
- 132 Janice Dr
- 359 E 4th St
- 22 S Garfield St
- 307 E 4th St
- 393 E 4th St
- 308 E 4th St
- 394 E 4th St
- 15 N Jefferson St
- 16 N Garfield St
- 24 N Garfield St
- 54 S Garfield St
- 54 S Garfield St
- 32 N Garfield St
- 35 N Jefferson St
- 38 S Jefferson St
- 40 N Jefferson St
- 40 N Garfield St
- 45 N Jefferson St
- 47 Washington St
- 53 S Garfield St
- 40 S Jefferson St
Your Personal Tour Guide
Ask me questions while you tour the home.