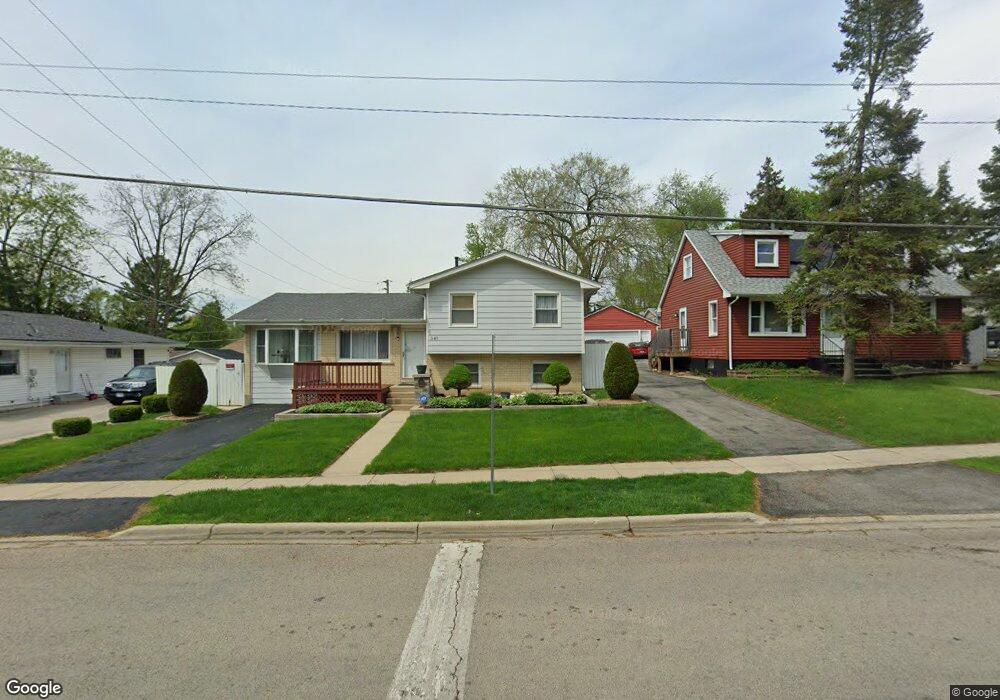
341 E Brown St West Chicago, IL 60185
Chicago West NeighborhoodEstimated Value: $308,618 - $354,000
Studio
--
Bath
1,196
Sq Ft
$272/Sq Ft
Est. Value
About This Home
This home is located at 341 E Brown St, West Chicago, IL 60185 and is currently estimated at $324,905, approximately $271 per square foot. 341 E Brown St is a home located in DuPage County with nearby schools including Gary Elementary School, Leman Middle School, and West Chicago Community High School.
Ownership History
Date
Name
Owned For
Owner Type
Purchase Details
Closed on
Dec 1, 2004
Sold by
Knight Edith T
Bought by
Penaflor Benjamin D and Penaflor Martha
Current Estimated Value
Home Financials for this Owner
Home Financials are based on the most recent Mortgage that was taken out on this home.
Original Mortgage
$126,560
Outstanding Balance
$61,346
Interest Rate
5.25%
Mortgage Type
Purchase Money Mortgage
Estimated Equity
$263,559
Purchase Details
Closed on
Nov 10, 2003
Sold by
Knight Edith T
Bought by
Knight Edith T and The Warren D Knight Irrevocable Family T
Purchase Details
Closed on
Sep 8, 1997
Sold by
Knight Warren D and Knight Edith T
Bought by
Knight Warren D and Knight Edith T
Purchase Details
Closed on
Mar 30, 1996
Sold by
Penaflor Benjamin D and Penaflor Martha A
Bought by
Knight Warren D and Knight Edith T
Create a Home Valuation Report for This Property
The Home Valuation Report is an in-depth analysis detailing your home's value as well as a comparison with similar homes in the area
Home Values in the Area
Average Home Value in this Area
Purchase History
| Date | Buyer | Sale Price | Title Company |
|---|---|---|---|
| Penaflor Benjamin D | $158,500 | Atg | |
| Knight Edith T | -- | -- | |
| Knight Warren D | -- | -- | |
| Knight Warren D | $120,000 | Chicago Title Insurance Co |
Source: Public Records
Mortgage History
| Date | Status | Borrower | Loan Amount |
|---|---|---|---|
| Open | Penaflor Benjamin D | $126,560 | |
| Closed | Penaflor Benjamin D | $31,640 |
Source: Public Records
Tax History Compared to Growth
Tax History
| Year | Tax Paid | Tax Assessment Tax Assessment Total Assessment is a certain percentage of the fair market value that is determined by local assessors to be the total taxable value of land and additions on the property. | Land | Improvement |
|---|---|---|---|---|
| 2024 | $3,413 | $94,260 | $19,982 | $74,278 |
| 2023 | $3,562 | $86,090 | $18,250 | $67,840 |
| 2022 | $4,108 | $80,480 | $17,070 | $63,410 |
| 2021 | $4,139 | $77,140 | $16,360 | $60,780 |
| 2020 | $4,194 | $74,790 | $15,860 | $58,930 |
| 2019 | $4,293 | $71,220 | $15,100 | $56,120 |
| 2018 | $4,386 | $65,960 | $13,990 | $51,970 |
| 2017 | $4,523 | $62,670 | $13,290 | $49,380 |
| 2016 | $4,742 | $58,430 | $12,390 | $46,040 |
| 2015 | $5,014 | $54,090 | $11,470 | $42,620 |
| 2014 | $5,051 | $54,070 | $11,460 | $42,610 |
| 2013 | $5,145 | $56,050 | $11,880 | $44,170 |
Source: Public Records
Map
Nearby Homes
- 144 E Pomeroy St
- 833 E Sterling Ave
- 155 S Oakwood Ave
- 264 Augusta Ave
- 790 Hillview Ave
- 253 Church St
- 151 Easton Ave
- 323 W Washington St
- 1350 Sarana Ave
- 247 N Neltnor Blvd Unit H1C
- 0N636 Sunset Ave
- 1N175 Ridgeland Ave
- 421 N Neltnor Blvd
- S639 Prince Crossing Rd
- 713 E Elmwood Ave
- 301 W Grand Lake Blvd
- 29W141 Oak Grove Rd
- 1N655 Ingalton Ave
- 4 VACANT LOTS James Ave
- LOT 10 Grandlake Blvd
- 345 E Brown St
- 323 E Brown St
- 319 E Brown St
- 349 E Brown St
- 703 Bishop St
- 353 E Brown St
- 311 E Brown St
- 328 E Pomeroy St
- 705 Bishop St
- 332 E Pomeroy St
- 320 E Pomeroy St
- 357 E Brown St
- 705 Bishop St
- 314 E Pomeroy St
- 320 E Brown St
- 307 E Brown St
- 336 E Pomeroy St
- 308 E Brown St
- 312 E Pomeroy St
- 709 Bishop St