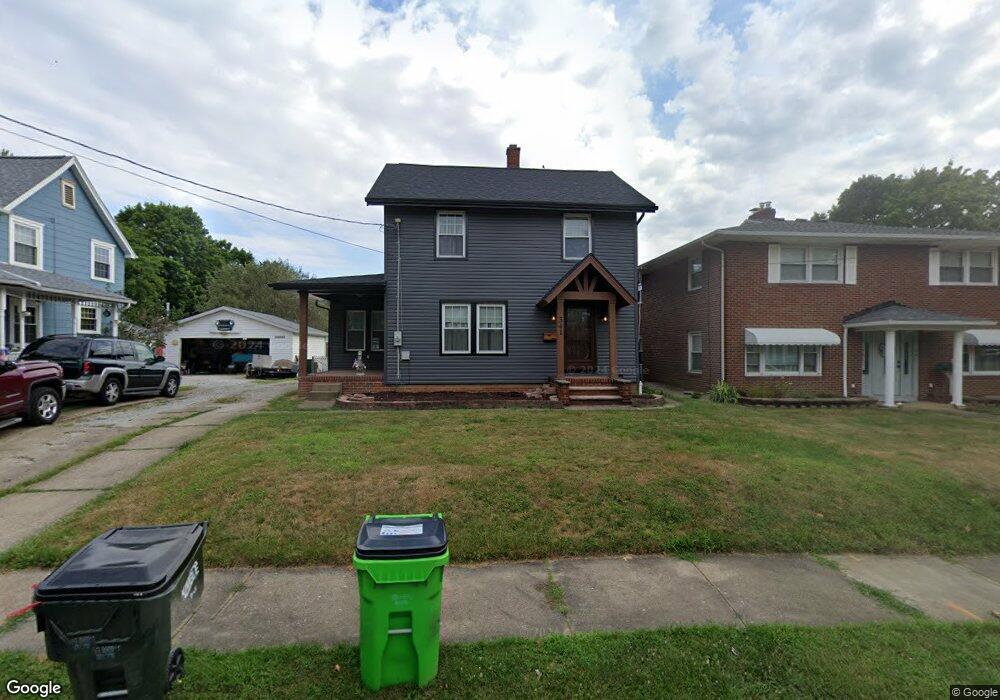
341 Edgewood St SE North Canton, OH 44720
Estimated Value: $186,807 - $221,000
3
Beds
2
Baths
1,332
Sq Ft
$154/Sq Ft
Est. Value
About This Home
This home is located at 341 Edgewood St SE, North Canton, OH 44720 and is currently estimated at $204,702, approximately $153 per square foot. 341 Edgewood St SE is a home located in Stark County with nearby schools including North Canton Middle School, Hoover High School, and St Paul School.
Ownership History
Date
Name
Owned For
Owner Type
Purchase Details
Closed on
Dec 12, 2023
Sold by
Cordero-Carter Santino D
Bought by
Cordero-Carter Santino D and Cordero-Carter Catherine
Current Estimated Value
Purchase Details
Closed on
May 23, 2005
Sold by
Cordero Carter Jayme A
Bought by
Cordero Carter Santino D
Purchase Details
Closed on
Nov 21, 2003
Sold by
Hawthorne Shane E and Hawthorne Cheri M
Bought by
Cordero Carter Santino D and Cordero Carter Jayme A
Home Financials for this Owner
Home Financials are based on the most recent Mortgage that was taken out on this home.
Original Mortgage
$123,000
Interest Rate
6.01%
Mortgage Type
Purchase Money Mortgage
Purchase Details
Closed on
Jul 8, 1997
Sold by
Wolf Gregory S
Bought by
Hawthorne Shane E and Hawthorne Cheri
Home Financials for this Owner
Home Financials are based on the most recent Mortgage that was taken out on this home.
Original Mortgage
$80,750
Interest Rate
8.01%
Mortgage Type
New Conventional
Create a Home Valuation Report for This Property
The Home Valuation Report is an in-depth analysis detailing your home's value as well as a comparison with similar homes in the area
Home Values in the Area
Average Home Value in this Area
Purchase History
| Date | Buyer | Sale Price | Title Company |
|---|---|---|---|
| Cordero-Carter Santino D | -- | None Listed On Document | |
| Cordero Carter Santino D | -- | -- | |
| Cordero Carter Santino D | $129,500 | -- | |
| Hawthorne Shane E | $85,000 | -- |
Source: Public Records
Mortgage History
| Date | Status | Borrower | Loan Amount |
|---|---|---|---|
| Previous Owner | Cordero Carter Santino D | $123,000 | |
| Previous Owner | Hawthorne Shane E | $80,750 |
Source: Public Records
Tax History Compared to Growth
Tax History
| Year | Tax Paid | Tax Assessment Tax Assessment Total Assessment is a certain percentage of the fair market value that is determined by local assessors to be the total taxable value of land and additions on the property. | Land | Improvement |
|---|---|---|---|---|
| 2025 | -- | $48,730 | $10,470 | $38,260 |
| 2024 | -- | $48,730 | $10,470 | $38,260 |
| 2023 | $1,776 | $33,180 | $8,960 | $24,220 |
| 2022 | $1,708 | $33,180 | $8,960 | $24,220 |
| 2021 | $1,648 | $33,180 | $8,960 | $24,220 |
| 2020 | $1,622 | $29,340 | $7,810 | $21,530 |
| 2019 | $1,515 | $29,340 | $7,810 | $21,530 |
| 2018 | $1,570 | $29,340 | $7,810 | $21,530 |
| 2017 | $1,433 | $28,110 | $9,240 | $18,870 |
| 2016 | $2,365 | $28,110 | $9,240 | $18,870 |
| 2015 | $1,669 | $32,520 | $9,240 | $23,280 |
| 2014 | $1,588 | $28,880 | $8,190 | $20,690 |
| 2013 | $797 | $28,880 | $8,190 | $20,690 |
Source: Public Records
Map
Nearby Homes
- 714 Pershing Ave SE
- 326 Bachtel St SW
- 634 Edgewood St SE
- 701 Edgewood St SE
- 406 Hower St NE
- 448 Hower St NE
- 404 Cordelia St SW
- 505 Rose Lane St SE
- 218 Bonnett St SW
- 360 Woodside Ave NE
- 161 Hallum St SW
- 140 5th St NE
- 1118 Overridge Ave SE
- 1126 Overridge Ave SE
- 1321 Clinton Ave SE
- 221 Briar Ave NE
- 455 Royer Ave NW
- 139 Maplecrest St SW
- 727 Lorena St SW
- 825 6th St NE
- 347 Edgewood St SE
- 339 Edgewood St SE
- 349 Edgewood St SE
- 335 Edgewood St SE
- 353 Edgewood St SE
- 329 Edgewood St SE
- * Edgewood St SE
- 328 Fairview St SE
- 324 Fairview St SE
- 323 Edgewood St SE
- 320 Fairview St SE
- 342 Edgewood St SE
- 334 Fairview St SE
- 336 Edgewood St SE
- 310 Fairview St SE
- 350 Edgewood St SE
- 332 Edgewood St SE
- 503 Foster Ave SE
- 319 Edgewood St SE
- 354 Edgewood St SE