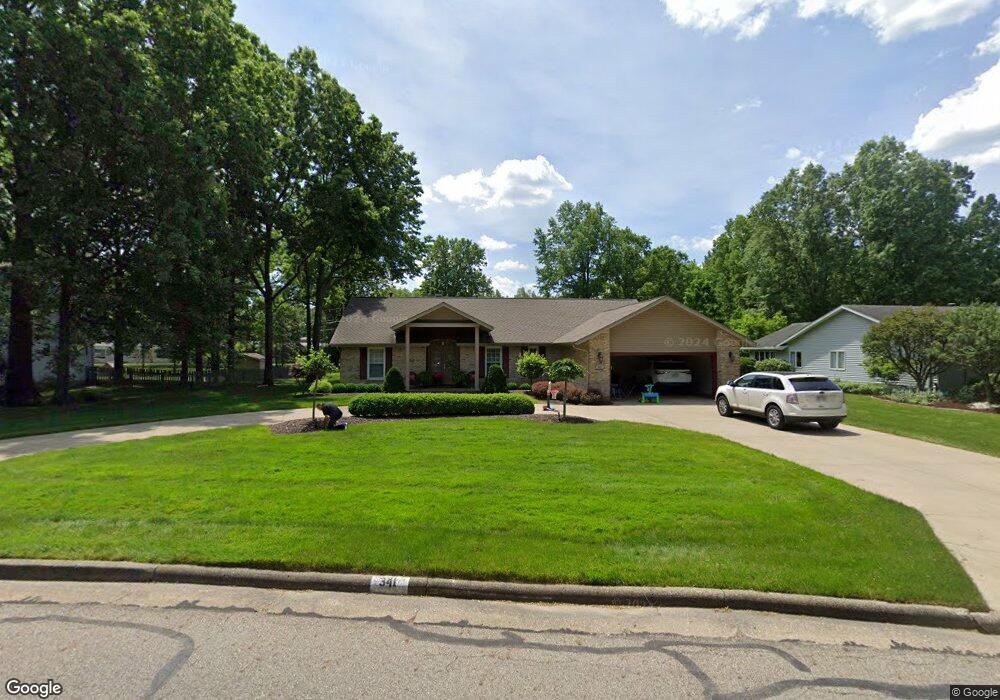
341 Findlay Ave Canfield, OH 44406
Estimated Value: $290,000 - $352,000
3
Beds
3
Baths
1,938
Sq Ft
$169/Sq Ft
Est. Value
About This Home
This home is located at 341 Findlay Ave, Canfield, OH 44406 and is currently estimated at $327,035, approximately $168 per square foot. 341 Findlay Ave is a home located in Mahoning County with nearby schools including Canfield Village Middle School and Canfield High School.
Ownership History
Date
Name
Owned For
Owner Type
Purchase Details
Closed on
Oct 13, 2025
Sold by
Anderson Colleen
Bought by
Colleen Anderson Family Trust and Anderson
Current Estimated Value
Purchase Details
Closed on
Sep 24, 2025
Sold by
Anderson Samuel G
Bought by
Anderson Colleen
Purchase Details
Closed on
May 5, 2006
Sold by
Walsh Brian J
Bought by
Anderson Samuel G and Anderson Colleen
Home Financials for this Owner
Home Financials are based on the most recent Mortgage that was taken out on this home.
Original Mortgage
$170,050
Interest Rate
6.39%
Mortgage Type
Fannie Mae Freddie Mac
Purchase Details
Closed on
Jul 19, 2001
Sold by
Walsh Denise Renee and Jackintell Denise Renee
Bought by
Walsh Brian J
Purchase Details
Closed on
May 17, 1999
Sold by
Shook Thomas G and Shook Kathy M
Bought by
Walsh Brian J
Home Financials for this Owner
Home Financials are based on the most recent Mortgage that was taken out on this home.
Original Mortgage
$127,600
Interest Rate
7.04%
Purchase Details
Closed on
Jul 9, 1990
Bought by
Shook Thomas G and Shook Kathy
Create a Home Valuation Report for This Property
The Home Valuation Report is an in-depth analysis detailing your home's value as well as a comparison with similar homes in the area
Home Values in the Area
Average Home Value in this Area
Purchase History
| Date | Buyer | Sale Price | Title Company |
|---|---|---|---|
| Colleen Anderson Family Trust | -- | None Listed On Document | |
| Anderson Colleen | -- | None Listed On Document | |
| Anderson Samuel G | $179,000 | None Available | |
| Walsh Brian J | -- | -- | |
| Walsh Brian J | $159,500 | -- | |
| Shook Thomas G | $143,500 | -- |
Source: Public Records
Mortgage History
| Date | Status | Borrower | Loan Amount |
|---|---|---|---|
| Previous Owner | Anderson Samuel G | $170,050 | |
| Previous Owner | Walsh Brian J | $127,600 |
Source: Public Records
Tax History
| Year | Tax Paid | Tax Assessment Tax Assessment Total Assessment is a certain percentage of the fair market value that is determined by local assessors to be the total taxable value of land and additions on the property. | Land | Improvement |
|---|---|---|---|---|
| 2025 | $3,828 | $88,840 | $15,120 | $73,720 |
| 2024 | $3,829 | $88,840 | $15,120 | $73,720 |
| 2023 | $3,768 | $88,840 | $15,120 | $73,720 |
| 2022 | $3,854 | $72,290 | $15,030 | $57,260 |
| 2021 | $3,740 | $72,290 | $15,030 | $57,260 |
| 2020 | $3,755 | $72,290 | $15,030 | $57,260 |
| 2019 | $3,567 | $62,320 | $12,960 | $49,360 |
| 2018 | $3,523 | $62,320 | $12,960 | $49,360 |
| 2017 | $3,520 | $62,320 | $12,960 | $49,360 |
| 2016 | $2,964 | $53,440 | $11,510 | $41,930 |
| 2015 | $2,898 | $53,440 | $11,510 | $41,930 |
| 2014 | $2,910 | $53,440 | $11,510 | $41,930 |
| 2013 | $2,805 | $53,440 | $11,510 | $41,930 |
Source: Public Records
Map
Nearby Homes
- 675 Blueberry Hill Dr
- 492 Hickory Hollow Dr
- 317 Verdant Ln
- 195 Willow Bend Dr
- 91 Villa Theresa Ln
- 81 Villa Theresa Ln
- 90 Villa Theresa Ln
- 71 Villa Theresa Ln
- 80 Villa Theresa Ln
- 61 Villa Theresa Ln
- 51 Villa Theresa Ln
- 9 Willow Way
- 41 Villa Theresa Ln
- 31 Villa Theresa Ln
- 30 Villa Theresa Ln
- 21 Villa Theresa Ln
- 52 Lakhani Ln
- 20 Villa Theresa Ln
- 10 Villa Theresa Ln
- 25 Willow Bend Dr
- 351 Findlay Ave
- 331 Findlay Ave
- 580 Blueberry Hill Dr
- 361 Findlay Ave
- 401 Greenmont Dr
- 1 Blueberry Hill Dr
- 380 Deer Trail Ave
- 590 Blueberry Hill Dr
- 371 Findlay Ave
- 409 Greenmont Dr
- 585 Blueberry Hill Dr
- 370 Deer Trail Ave
- 600 Blueberry Hill Dr
- 400 Greenmont Dr
- 417 Greenmont Dr
- 613 N Briarcliff Dr
- 381 Findlay Ave
- 375 Sleepy Hollow Dr
- 408 Greenmont Dr
- 605 N Briarcliff Dr
Your Personal Tour Guide
Ask me questions while you tour the home.