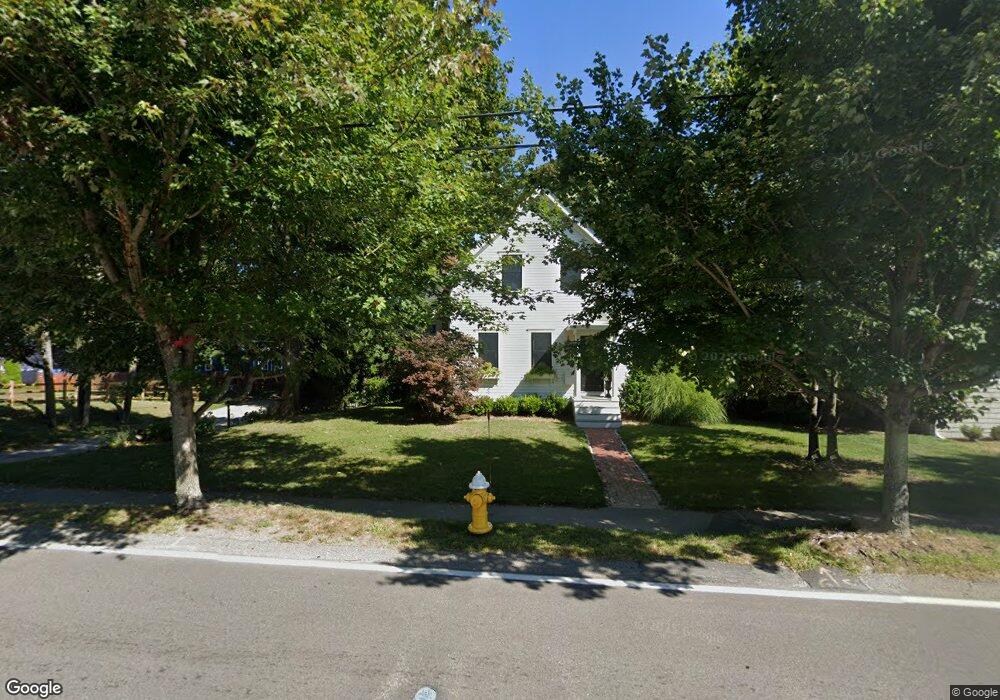
341 High St Hingham, MA 02043
Estimated Value: $1,013,507 - $1,279,000
4
Beds
2
Baths
2,375
Sq Ft
$503/Sq Ft
Est. Value
About This Home
This home is located at 341 High St, Hingham, MA 02043 and is currently estimated at $1,193,877, approximately $502 per square foot. 341 High St is a home located in Plymouth County with nearby schools including Abigail Adams Middle School, Weymouth Middle School Chapman, and Weymouth High School.
Ownership History
Date
Name
Owned For
Owner Type
Purchase Details
Closed on
Jun 30, 1994
Sold by
Russell Daniel D and Russell Heidi H
Bought by
Swanson Michael and Swanson Lisa M
Current Estimated Value
Purchase Details
Closed on
Mar 23, 1992
Sold by
Ayers Const Corp
Bought by
Russell Daniel D and Hibben Heidi C
Purchase Details
Closed on
Feb 27, 1990
Sold by
Cor Ayers Construct
Bought by
Russell Daniel D
Purchase Details
Closed on
Jun 19, 1989
Sold by
Flaherty John Est
Bought by
Ayers Construction
Create a Home Valuation Report for This Property
The Home Valuation Report is an in-depth analysis detailing your home's value as well as a comparison with similar homes in the area
Purchase History
| Date | Buyer | Sale Price | Title Company |
|---|---|---|---|
| Swanson Michael | $201,000 | -- | |
| Russell Daniel D | $195,000 | -- | |
| Russell Daniel D | $195,000 | -- | |
| Ayers Construction | $19,000 | -- |
Source: Public Records
Mortgage History
| Date | Status | Borrower | Loan Amount |
|---|---|---|---|
| Open | Ayers Construction | $50,000 |
Source: Public Records
Tax History
| Year | Tax Paid | Tax Assessment Tax Assessment Total Assessment is a certain percentage of the fair market value that is determined by local assessors to be the total taxable value of land and additions on the property. | Land | Improvement |
|---|---|---|---|---|
| 2025 | $9,307 | $870,600 | $360,800 | $509,800 |
| 2024 | $8,332 | $767,900 | $360,800 | $407,100 |
| 2023 | $7,864 | $723,500 | $335,000 | $388,500 |
| 2022 | $7,832 | $677,500 | $292,000 | $385,500 |
| 2021 | $7,472 | $633,200 | $292,000 | $341,200 |
| 2020 | $7,301 | $633,200 | $292,000 | $341,200 |
| 2019 | $7,230 | $612,200 | $292,000 | $320,200 |
| 2018 | $7,702 | $654,400 | $292,000 | $362,400 |
| 2017 | $7,384 | $602,800 | $300,600 | $302,200 |
| 2016 | $7,349 | $588,400 | $286,200 | $302,200 |
| 2015 | $6,954 | $555,000 | $252,800 | $302,200 |
Source: Public Records
Map
Nearby Homes
- 1297 Pleasant St
- 43 Filomena St
- 1 Hemlock Rd
- 425 East St
- 2 Black Rock Dr Unit 21
- 2 Black Rock Dr
- 156 Fort Hill St
- 575 Broad St Unit 315
- 575 Broad St Unit 215
- 573 Broad St Unit 325
- 14 Cross St
- 71 Charles St
- 67 Charles St
- 5 Endicott St
- 6 Brewer Way
- 30 Puritan Rd
- 209 Lake St Unit 65
- 270 Middle St
- 148 Chard St
- 78 Middle St
Your Personal Tour Guide
Ask me questions while you tour the home.