341 Main St Beech Grove, IN 46107
Estimated Value: $242,137
--
Bed
--
Bath
1,600
Sq Ft
$151/Sq Ft
Est. Value
About This Home
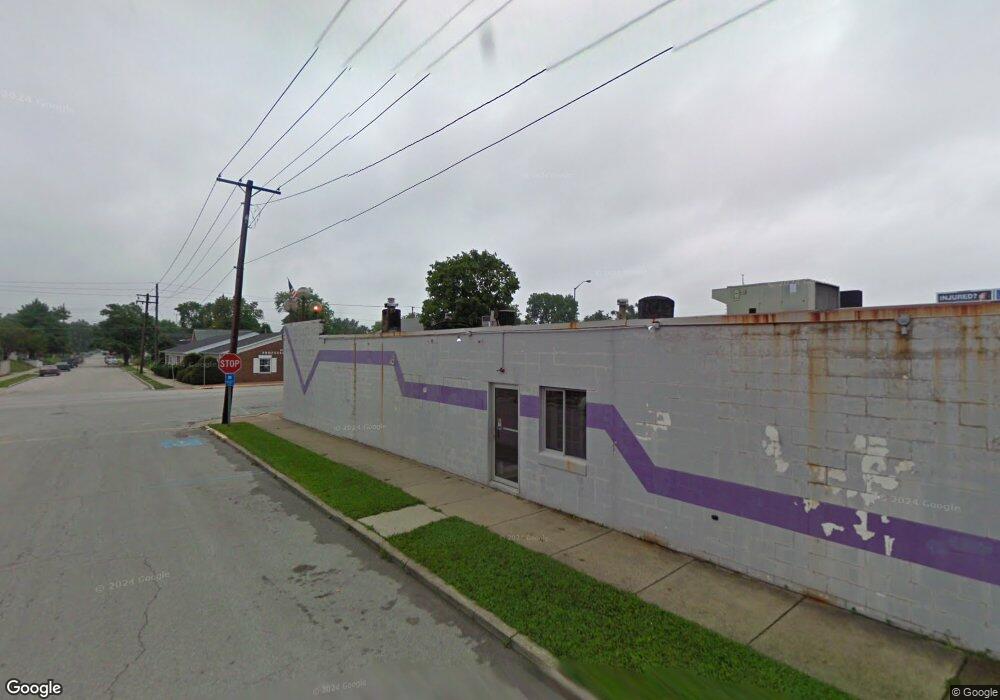
This home is located at 341 Main St, Beech Grove, IN 46107 and is currently estimated at $242,137, approximately $151 per square foot. 341 Main St is a home located in Marion County with nearby schools including Hornet Park Elementary School, Central Elementary School, and South Grove Intermediate School.
Ownership History
Date
Name
Owned For
Owner Type
Purchase Details
Closed on
Dec 28, 2017
Sold by
Allan Combs Mitchell
Current Estimated Value
Home Financials for this Owner
Home Financials are based on the most recent Mortgage that was taken out on this home.
Original Mortgage
$112,749
Outstanding Balance
$95,098
Interest Rate
3.92%
Mortgage Type
New Conventional
Estimated Equity
$147,039
Purchase Details
Closed on
Aug 3, 2015
Sold by
Draughon Barbara A
Bought by
Combs Mitchell Allan
Purchase Details
Closed on
Jan 24, 2011
Sold by
Combs Melissa A
Bought by
Draughon Barbara A
Create a Home Valuation Report for This Property
The Home Valuation Report is an in-depth analysis detailing your home's value as well as a comparison with similar homes in the area
Home Values in the Area
Average Home Value in this Area
Purchase History
| Date | Buyer | Sale Price | Title Company |
|---|---|---|---|
| -- | $125,000 | -- | |
| Jeffs Mobile Grooming Inc | -- | Lenders Escrow & Title Servi | |
| Combs Mitchell Allan | -- | None Available | |
| Draughon Barbara A | -- | None Available |
Source: Public Records
Mortgage History
| Date | Status | Borrower | Loan Amount |
|---|---|---|---|
| Open | Jeffs Mobile Grooming Inc | $112,749 |
Source: Public Records
Tax History Compared to Growth
Tax History
| Year | Tax Paid | Tax Assessment Tax Assessment Total Assessment is a certain percentage of the fair market value that is determined by local assessors to be the total taxable value of land and additions on the property. | Land | Improvement |
|---|---|---|---|---|
| 2024 | $2,307 | $60,900 | $12,900 | $48,000 |
| 2023 | $2,307 | $60,900 | $12,900 | $48,000 |
| 2022 | $2,351 | $60,900 | $12,900 | $48,000 |
| 2021 | $2,114 | $56,100 | $11,800 | $44,300 |
| 2020 | $2,351 | $56,100 | $11,800 | $44,300 |
| 2019 | $2,203 | $54,100 | $11,800 | $42,300 |
| 2018 | $2,156 | $54,100 | $11,800 | $42,300 |
| 2017 | $1,856 | $53,000 | $11,800 | $41,200 |
| 2016 | $1,805 | $51,900 | $11,800 | $40,100 |
| 2014 | $1,759 | $52,500 | $11,800 | $40,700 |
| 2013 | $1,759 | $52,500 | $11,800 | $40,700 |
Source: Public Records
Map
Nearby Homes