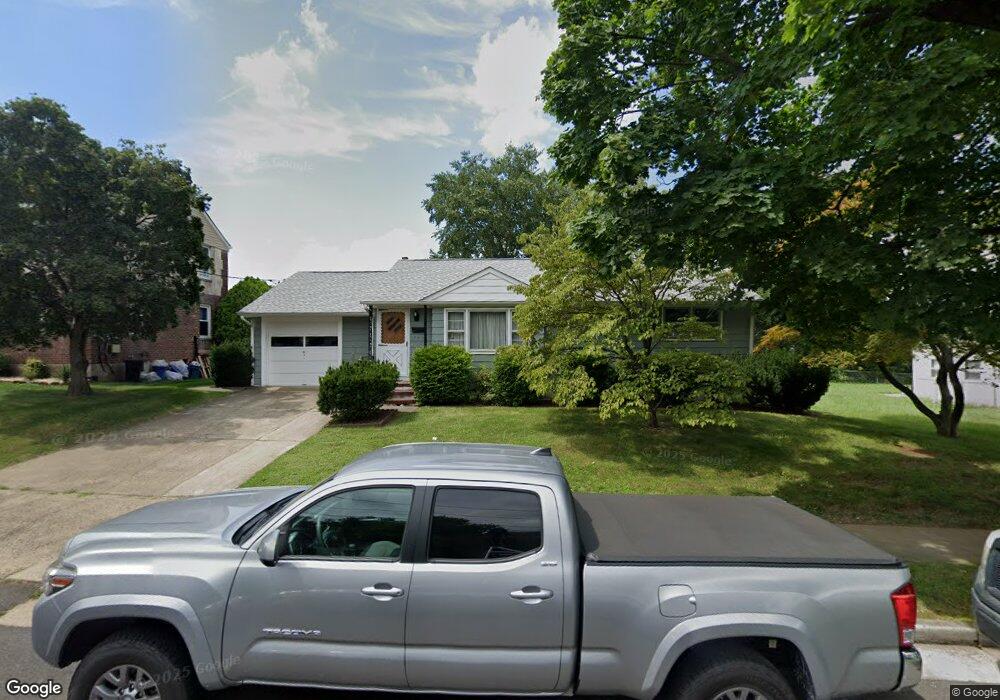
341 N 6th Ave Manville, NJ 08835
Estimated Value: $376,133 - $460,000
--
Bed
--
Bath
932
Sq Ft
$455/Sq Ft
Est. Value
About This Home
This home is located at 341 N 6th Ave, Manville, NJ 08835 and is currently estimated at $424,283, approximately $455 per square foot. 341 N 6th Ave is a home located in Somerset County with nearby schools including Weston Elementary School, Roosevelt School, and Alexander Batcho Intermediate School (ABIS).
Ownership History
Date
Name
Owned For
Owner Type
Purchase Details
Closed on
Jan 31, 2012
Sold by
Kelco Andrew and Simoncelli Lucille
Bought by
Kelco Steven
Current Estimated Value
Home Financials for this Owner
Home Financials are based on the most recent Mortgage that was taken out on this home.
Original Mortgage
$120,000
Outstanding Balance
$82,488
Interest Rate
3.96%
Mortgage Type
Purchase Money Mortgage
Estimated Equity
$341,795
Create a Home Valuation Report for This Property
The Home Valuation Report is an in-depth analysis detailing your home's value as well as a comparison with similar homes in the area
Home Values in the Area
Average Home Value in this Area
Purchase History
| Date | Buyer | Sale Price | Title Company |
|---|---|---|---|
| Kelco Steven | $200,000 | None Available |
Source: Public Records
Mortgage History
| Date | Status | Borrower | Loan Amount |
|---|---|---|---|
| Open | Kelco Steven | $120,000 |
Source: Public Records
Tax History Compared to Growth
Tax History
| Year | Tax Paid | Tax Assessment Tax Assessment Total Assessment is a certain percentage of the fair market value that is determined by local assessors to be the total taxable value of land and additions on the property. | Land | Improvement |
|---|---|---|---|---|
| 2025 | $6,872 | $336,100 | $214,700 | $121,400 |
| 2024 | $6,872 | $305,300 | $186,200 | $119,100 |
| 2023 | $7,032 | $292,500 | $167,200 | $125,300 |
| 2022 | $6,762 | $258,500 | $138,700 | $119,800 |
| 2021 | $6,126 | $217,200 | $110,200 | $107,000 |
| 2020 | $6,389 | $202,900 | $100,700 | $102,200 |
| 2019 | $6,403 | $196,000 | $100,700 | $95,300 |
| 2018 | $6,452 | $197,300 | $100,700 | $96,600 |
| 2017 | $6,396 | $199,000 | $100,700 | $98,300 |
| 2016 | $6,165 | $199,000 | $100,700 | $98,300 |
| 2015 | $6,410 | $265,200 | $163,400 | $101,800 |
| 2014 | $6,283 | $265,200 | $163,400 | $101,800 |
Source: Public Records
Map
Nearby Homes