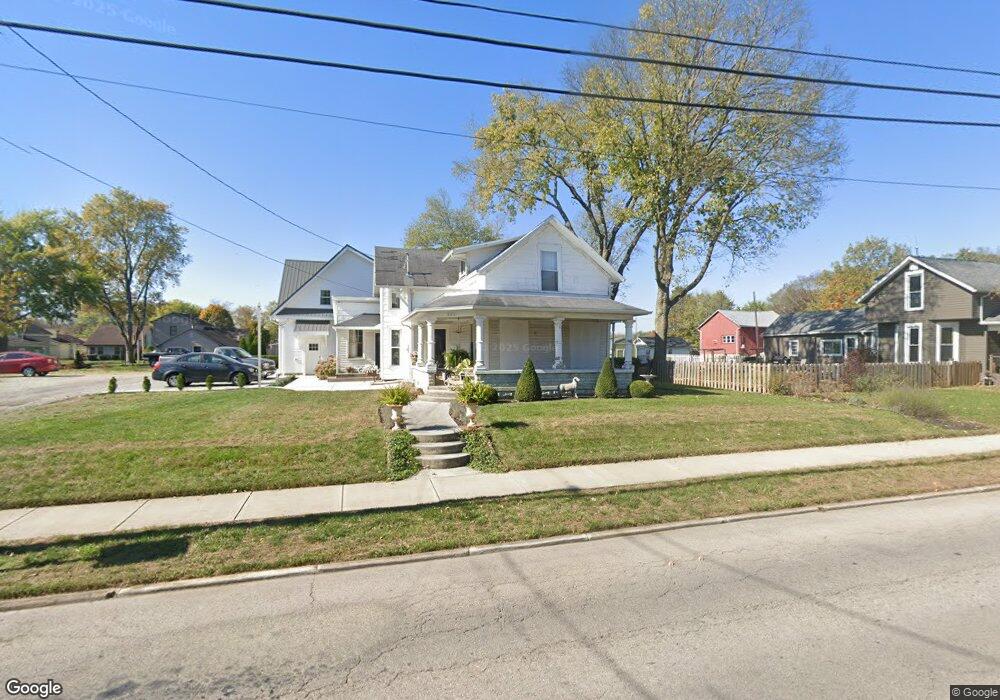
341 N High St Covington, OH 45318
Estimated Value: $234,000 - $272,000
3
Beds
2
Baths
1,735
Sq Ft
$142/Sq Ft
Est. Value
About This Home
This home is located at 341 N High St, Covington, OH 45318 and is currently estimated at $246,164, approximately $141 per square foot. 341 N High St is a home located in Miami County with nearby schools including Covington Elementary/Junior High School, Covington Junior High School, and Covington High School.
Ownership History
Date
Name
Owned For
Owner Type
Purchase Details
Closed on
Feb 8, 2011
Sold by
Flory Travis L
Bought by
Flory Travis L and Flory Jill E
Current Estimated Value
Purchase Details
Closed on
Apr 9, 1996
Sold by
Wright Rick F
Bought by
Lee John W and Lee Romney M
Purchase Details
Closed on
Dec 11, 1995
Sold by
Hickman Oea W
Bought by
Wright Rick F and Wright Pamela L
Home Financials for this Owner
Home Financials are based on the most recent Mortgage that was taken out on this home.
Original Mortgage
$44,000
Interest Rate
9%
Mortgage Type
New Conventional
Purchase Details
Closed on
Jan 1, 1990
Bought by
Hickman Ora W
Create a Home Valuation Report for This Property
The Home Valuation Report is an in-depth analysis detailing your home's value as well as a comparison with similar homes in the area
Home Values in the Area
Average Home Value in this Area
Purchase History
| Date | Buyer | Sale Price | Title Company |
|---|---|---|---|
| Flory Travis L | -- | -- | |
| Lee John W | $53,000 | -- | |
| Wright Rick F | $55,000 | -- | |
| Hickman Ora W | -- | -- |
Source: Public Records
Mortgage History
| Date | Status | Borrower | Loan Amount |
|---|---|---|---|
| Previous Owner | Wright Rick F | $44,000 |
Source: Public Records
Tax History
| Year | Tax Paid | Tax Assessment Tax Assessment Total Assessment is a certain percentage of the fair market value that is determined by local assessors to be the total taxable value of land and additions on the property. | Land | Improvement |
|---|---|---|---|---|
| 2025 | $2,978 | $91,220 | $12,500 | $78,720 |
| 2024 | $2,978 | $75,220 | $13,550 | $61,670 |
| 2023 | $2,818 | $75,220 | $13,550 | $61,670 |
| 2022 | $2,811 | $75,220 | $13,550 | $61,670 |
| 2021 | $1,987 | $26,290 | $10,430 | $15,860 |
| 2020 | $1,086 | $26,290 | $10,430 | $15,860 |
| 2019 | $1,126 | $27,130 | $10,430 | $16,700 |
| 2018 | $947 | $22,750 | $8,120 | $14,630 |
| 2017 | $964 | $22,750 | $8,120 | $14,630 |
| 2016 | $952 | $22,750 | $8,120 | $14,630 |
| 2015 | $879 | $21,880 | $7,810 | $14,070 |
| 2014 | $879 | $21,880 | $7,810 | $14,070 |
| 2013 | $848 | $21,880 | $7,810 | $14,070 |
Source: Public Records
Map
Nearby Homes
Your Personal Tour Guide
Ask me questions while you tour the home.