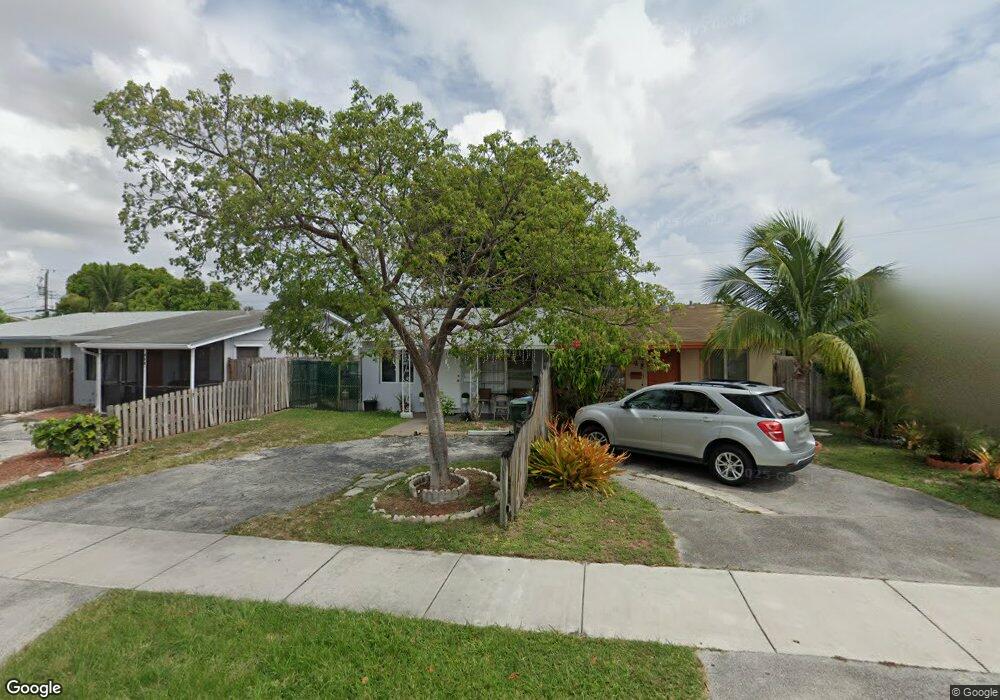
341 NE 57th Ct Fort Lauderdale, FL 33334
North Andrews Gardens NeighborhoodEstimated Value: $177,451 - $354,000
2
Beds
1
Bath
880
Sq Ft
$323/Sq Ft
Est. Value
About This Home
This home is located at 341 NE 57th Ct, Fort Lauderdale, FL 33334 and is currently estimated at $283,817, approximately $322 per square foot. 341 NE 57th Ct is a home located in Broward County with nearby schools including North Andrews Gardens Elementary School, James S. Rickards Middle School, and Northeast High School.
Ownership History
Date
Name
Owned For
Owner Type
Purchase Details
Closed on
Jun 15, 2020
Sold by
Pf Development Llc
Bought by
Pf Rental Iv Llc
Current Estimated Value
Purchase Details
Closed on
Apr 24, 2020
Sold by
Murphy Thomas Edward
Bought by
Pf Development Llc
Purchase Details
Closed on
Aug 15, 2017
Sold by
Milian Orlando and Milian Maria
Bought by
Murphy Thomas Edward
Purchase Details
Closed on
Nov 19, 2014
Sold by
Solis Ivonne and Milian Orlando
Bought by
Milian Jessica and Wessel Jennifer M
Purchase Details
Closed on
Jun 16, 2006
Sold by
Sanchez Armando E and Sanchez Josefina
Bought by
Solis Ivonne
Purchase Details
Closed on
Jun 14, 1995
Sold by
Solis Ivonne and Milian Ivonne
Bought by
Sanchez Armando E and Sanchez Josefina
Purchase Details
Closed on
Dec 1, 1988
Sold by
Available Not
Bought by
Available Not
Create a Home Valuation Report for This Property
The Home Valuation Report is an in-depth analysis detailing your home's value as well as a comparison with similar homes in the area
Home Values in the Area
Average Home Value in this Area
Purchase History
| Date | Buyer | Sale Price | Title Company |
|---|---|---|---|
| Pf Rental Iv Llc | -- | Attorney | |
| Pf Development Llc | $104,500 | Attorney | |
| Murphy Thomas Edward | $100,000 | Attorney | |
| Milian Jessica | -- | Attorney | |
| Solis Ivonne | -- | None Available | |
| Sanchez Armando E | $40,000 | -- | |
| Available Not | $40,543 | -- |
Source: Public Records
Mortgage History
| Date | Status | Borrower | Loan Amount |
|---|---|---|---|
| Previous Owner | Solis Ivonne | $50,000 |
Source: Public Records
Tax History Compared to Growth
Tax History
| Year | Tax Paid | Tax Assessment Tax Assessment Total Assessment is a certain percentage of the fair market value that is determined by local assessors to be the total taxable value of land and additions on the property. | Land | Improvement |
|---|---|---|---|---|
| 2025 | $5,262 | $224,690 | -- | -- |
| 2024 | $4,919 | $224,690 | -- | -- |
| 2023 | $4,919 | $185,700 | $0 | $0 |
| 2022 | $4,380 | $168,820 | $0 | $0 |
| 2021 | $3,748 | $153,480 | $21,000 | $132,480 |
| 2020 | $2,927 | $127,760 | $18,000 | $109,760 |
| 2019 | $2,664 | $113,270 | $18,000 | $95,270 |
| 2018 | $2,358 | $93,040 | $16,500 | $76,540 |
| 2017 | $2,005 | $73,810 | $0 | $0 |
| 2016 | $1,958 | $69,100 | $0 | $0 |
| 2015 | $1,837 | $62,820 | $0 | $0 |
| 2014 | $1,506 | $46,070 | $0 | $0 |
| 2013 | -- | $45,330 | $15,000 | $30,330 |
Source: Public Records
Map
Nearby Homes
- 351 NE 57th Ct
- 410 NE 58th Ct
- 5654 NE 5th Ave
- 5901 NE 4th Ave
- 500 NE 59th St
- 120 NE 57th Ct
- 620 NE 57th St
- 241 NE 55th St
- 5940 NE 1st Terrace
- 641 NE 56th Ct
- 21 NE 57th Ct
- 5750 N Andrews Ave
- 5408 NE 3rd Terrace
- 5409 NE 4th Ave
- 5433 NE 5th Ave
- 6100 NE 4th Ave
- 131 NE 55th St
- 5850 NE 7th Ave
- 550 NE 61st St
- 561 NE 61st St
- 341 NE 57th Ct
- 341 NE 57th Ct
- 341 NE 57th Ct Unit 1
- 351 NE 57th Ct
- 331 NE 57th Ct
- 340B NE 58th St
- 340 NE 58th St
- 321 NE 57th Ct
- 321 NE 57th Ct
- 361A NE 57th Ct
- 350 NE 58th St Unit A
- 350 NE 58th St
- 330 NE 58th St
- 361B NE 57th Ct
- 330 NE 57th Ct
- 330 NE 57th Ct
- 320A NE 58th St
- 320 NE 58th St
- 360 NE 58th St