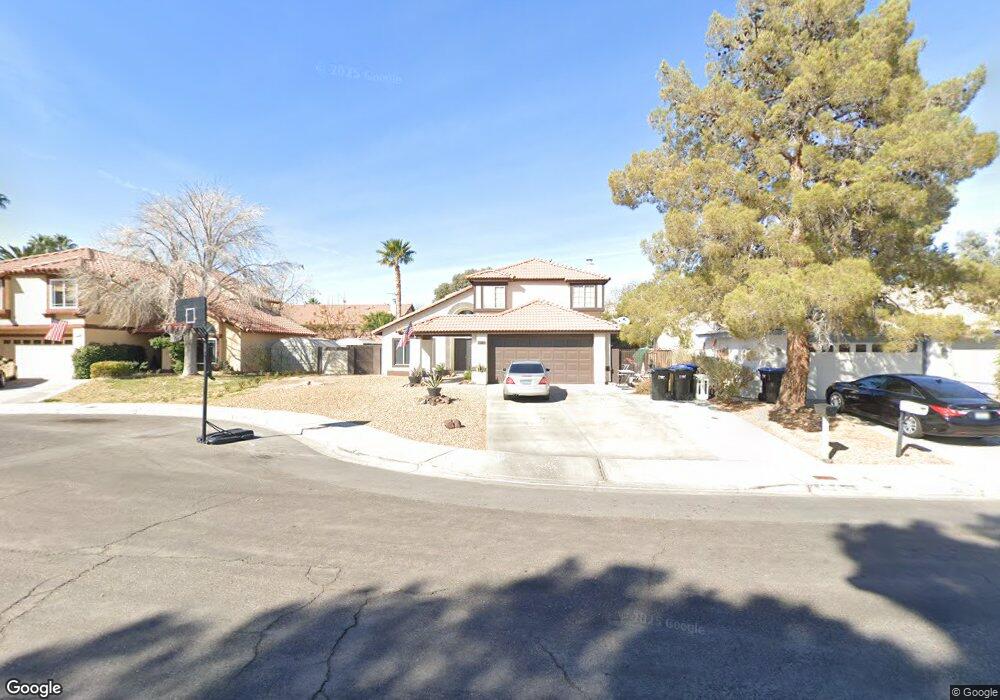
341 Nuevo Ct Henderson, NV 89014
Green Valley North NeighborhoodEstimated Value: $519,757 - $581,000
3
Beds
3
Baths
2,025
Sq Ft
$272/Sq Ft
Est. Value
About This Home
This home is located at 341 Nuevo Ct, Henderson, NV 89014 and is currently estimated at $549,939, approximately $271 per square foot. 341 Nuevo Ct is a home located in Clark County with nearby schools including James Gibson Elementary School, Barbara and Hank Greenspun Junior High School, and Green Valley High School.
Ownership History
Date
Name
Owned For
Owner Type
Purchase Details
Closed on
Nov 14, 2002
Sold by
Wyatt Edward James and Wyatt Deloris
Bought by
Oden Jed L
Current Estimated Value
Purchase Details
Closed on
Apr 11, 2002
Sold by
Weatherwax J Andrew
Bought by
Wyatt Edward James and Wyatt Deloris
Home Financials for this Owner
Home Financials are based on the most recent Mortgage that was taken out on this home.
Original Mortgage
$202,000
Interest Rate
6.87%
Mortgage Type
Seller Take Back
Purchase Details
Closed on
Feb 20, 2000
Sold by
Weatherwax Maryann
Bought by
Weatherwax J Andrew
Purchase Details
Closed on
Jan 27, 2000
Sold by
Weatherwax Wendy E
Bought by
Weatherwax J Andrew
Purchase Details
Closed on
Jan 21, 1999
Sold by
Benevento Saverio and Hanrahan Janne
Bought by
Weatherwax Wendy and Weatherwax Maryann
Home Financials for this Owner
Home Financials are based on the most recent Mortgage that was taken out on this home.
Original Mortgage
$149,150
Interest Rate
6.77%
Create a Home Valuation Report for This Property
The Home Valuation Report is an in-depth analysis detailing your home's value as well as a comparison with similar homes in the area
Home Values in the Area
Average Home Value in this Area
Purchase History
| Date | Buyer | Sale Price | Title Company |
|---|---|---|---|
| Oden Jed L | $215,009 | Land Title | |
| Wyatt Edward James | $212,000 | Land Title | |
| Weatherwax J Andrew | -- | -- | |
| Weatherwax J Andrew | $157,265 | -- | |
| Weatherwax Wendy | $157,000 | Stewart Title |
Source: Public Records
Mortgage History
| Date | Status | Borrower | Loan Amount |
|---|---|---|---|
| Previous Owner | Wyatt Edward James | $202,000 | |
| Previous Owner | Weatherwax Wendy | $149,150 |
Source: Public Records
Tax History Compared to Growth
Tax History
| Year | Tax Paid | Tax Assessment Tax Assessment Total Assessment is a certain percentage of the fair market value that is determined by local assessors to be the total taxable value of land and additions on the property. | Land | Improvement |
|---|---|---|---|---|
| 2025 | $2,621 | $99,614 | $38,500 | $61,114 |
| 2024 | $2,427 | $99,614 | $38,500 | $61,114 |
| 2023 | $2,427 | $98,004 | $39,200 | $58,804 |
| 2022 | $2,248 | $85,285 | $30,800 | $54,485 |
| 2021 | $2,081 | $82,104 | $29,750 | $52,354 |
| 2020 | $1,930 | $81,122 | $28,700 | $52,422 |
| 2019 | $1,809 | $76,230 | $24,150 | $52,080 |
| 2018 | $1,726 | $71,510 | $21,000 | $50,510 |
| 2017 | $2,107 | $72,693 | $21,000 | $51,693 |
| 2016 | $1,616 | $68,814 | $16,450 | $52,364 |
| 2015 | $1,612 | $61,641 | $12,600 | $49,041 |
| 2014 | $1,565 | $52,421 | $8,750 | $43,671 |
Source: Public Records
Map
Nearby Homes
- 316 Santa Monica Dr
- 2108 Running River Rd
- 272 Grand Teton Dr
- 1939 Guinn Dr
- 372 Rushing Creek Ct
- 1926 Navarre Ln
- 346 Pinnacle Ct
- 259 Spring Hills Ln
- 347 Gana Ct Unit B
- 291 Kershner Ct
- 2150 Running River Rd
- 371 Legacy Dr
- 322 Oliveiro Ct
- 409 Indigo Springs St
- 246 Windsong Dr
- 2050 W Warm Springs Rd Unit 224
- 2050 W Warm Springs Rd Unit 3624
- 2050 W Warm Springs Rd Unit 4521
- 2050 W Warm Springs Rd Unit 1311
- 2050 W Warm Springs Rd Unit 312