
Seller's Agent in 2023
Charles Turner
SeaShore Realty Group, Inc.
(910) 328-3400
13 in this area
36 Total Sales
Estimated Value: $297,000 - $329,000
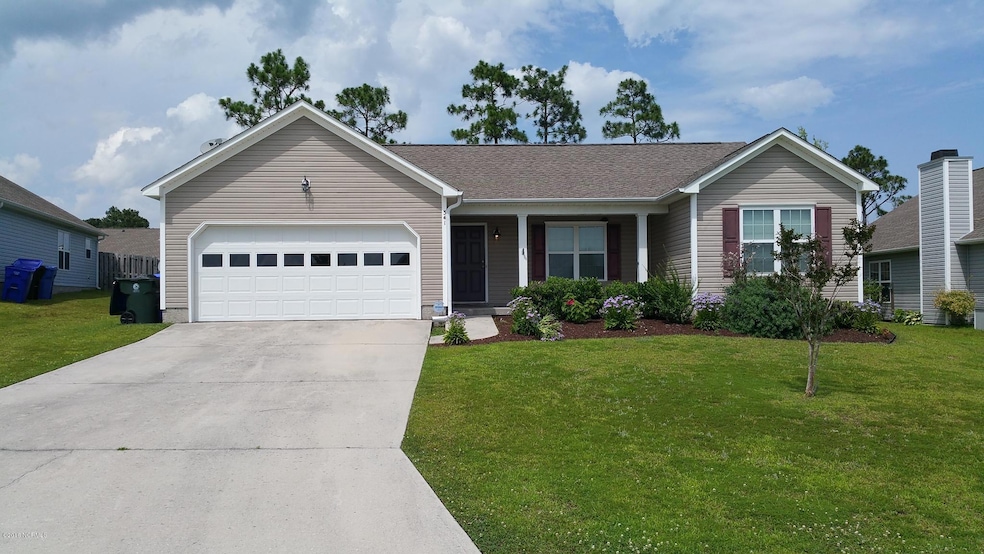
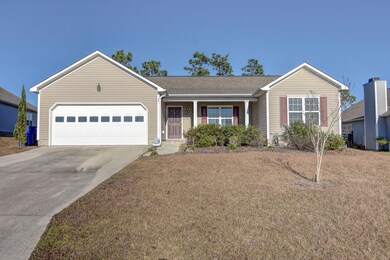
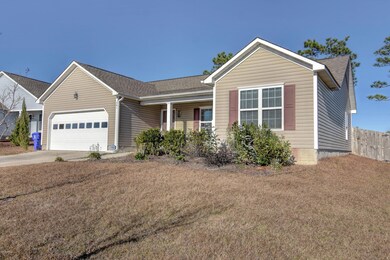
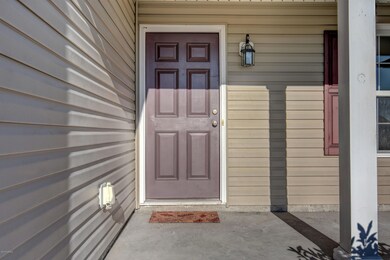
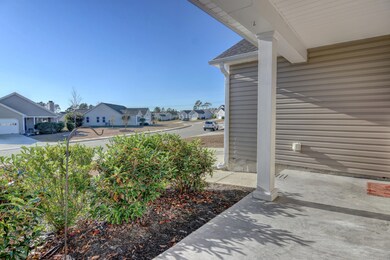
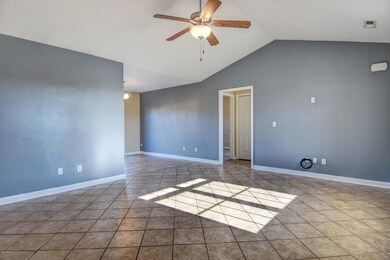
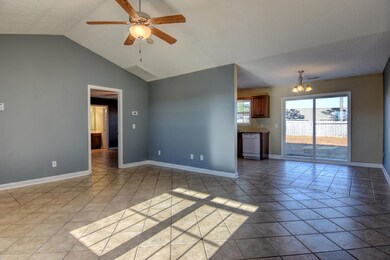
New Tenant April 1, 2023 TENANT RIGHTS still a great investment property. Pictures are dated; Split Floor Plan. Nestled in the heart of The Neighborhoods of Holly Ridge is a family home just waiting for you! This property is comprising a very generously sized lounge room, a large master bedroom and walk in closest. On the other side of the home are 2 additional bedrooms with a walk-in closet. This property is tiled throughout the home except the two bedrooms making cleaning very easy! The kitchen has a double-door fridge, stove top and microwave, as well as plenty of cupboard space. Off the kitchen is the dining area. There is carpet in the two spare bedrooms and only in the closet of the master bedroom. The 2-car garage has work benches perfect for any budding handy man and there is internal access to the house. The Neighborhoods of Holly Ridge is only a short commute to US HWY 17, Wilmington, Camp Lejeune, MARSOC, and New River Air Station.
Last Agent to Sell the Property
SeaShore Realty Group, Inc. License #222694 Listed on: 01/30/2023
| Date | Buyer | Sale Price | Title Company |
|---|---|---|---|
| Cassese Patrick J | $302,000 | None Listed On Document | |
| Hyde Jeffrey | $195,000 | None Available | |
| Younger Richard A | -- | National Link | |
| Younger Richard A | $173,000 | None Available |
| Date | Status | Borrower | Loan Amount |
|---|---|---|---|
| Open | Cassese Patrick J | $296,530 | |
| Previous Owner | Hyde Jeffrey | $195,000 | |
| Previous Owner | Younger Richard A | $156,711 | |
| Previous Owner | Younger Richard A | $176,617 |
| Date | Event | Price | List to Sale | Price per Sq Ft | Prior Sale |
|---|---|---|---|---|---|
| 10/31/2023 10/31/23 | Sold | $302,000 | +16677.8% | $239 / Sq Ft | |
| 10/09/2023 10/09/23 | Pending | -- | -- | -- | |
| 04/01/2023 04/01/23 | Rented | $1,800 | 0.0% | -- | |
| 02/28/2023 02/28/23 | Price Changed | $1,800 | +0.3% | $1 / Sq Ft | |
| 02/14/2023 02/14/23 | Price Changed | $1,795 | 0.0% | $1 / Sq Ft | |
| 02/10/2023 02/10/23 | Price Changed | $314,900 | -3.1% | $249 / Sq Ft | |
| 01/30/2023 01/30/23 | For Sale | $324,900 | 0.0% | $257 / Sq Ft | |
| 01/18/2023 01/18/23 | Price Changed | $1,800 | -9.8% | $1 / Sq Ft | |
| 01/06/2023 01/06/23 | For Rent | $1,995 | +10.8% | -- | |
| 10/15/2022 10/15/22 | Rented | $1,800 | 0.0% | -- | |
| 09/27/2022 09/27/22 | Price Changed | $1,800 | -5.3% | $1 / Sq Ft | |
| 09/13/2022 09/13/22 | Price Changed | $1,900 | -5.0% | $2 / Sq Ft | |
| 07/21/2022 07/21/22 | Price Changed | $2,000 | +0.3% | $2 / Sq Ft | |
| 05/31/2022 05/31/22 | Price Changed | $1,995 | +5.0% | $2 / Sq Ft | |
| 05/31/2022 05/31/22 | For Rent | $1,900 | 0.0% | -- | |
| 05/02/2022 05/02/22 | Off Market | $1,900 | -- | -- | |
| 04/28/2022 04/28/22 | Price Changed | $1,900 | +5.6% | $2 / Sq Ft | |
| 04/25/2022 04/25/22 | For Rent | $1,800 | 0.0% | -- | |
| 02/25/2022 02/25/22 | Off Market | $1,800 | -- | -- | |
| 01/20/2022 01/20/22 | Price Changed | $1,800 | +0.3% | $1 / Sq Ft | |
| 12/03/2021 12/03/21 | For Rent | $1,795 | 0.0% | -- | |
| 12/02/2021 12/02/21 | Off Market | $1,795 | -- | -- | |
| 11/03/2021 11/03/21 | For Rent | $1,795 | -10.0% | -- | |
| 04/26/2021 04/26/21 | Rented | $1,995 | 0.0% | -- | |
| 04/03/2021 04/03/21 | Price Changed | $1,995 | +24.7% | $2 / Sq Ft | |
| 04/02/2021 04/02/21 | For Rent | $1,600 | 0.0% | -- | |
| 04/01/2021 04/01/21 | Sold | $195,000 | -9.3% | $154 / Sq Ft | View Prior Sale |
| 02/16/2021 02/16/21 | Pending | -- | -- | -- | |
| 02/15/2021 02/15/21 | For Sale | $215,000 | 0.0% | $170 / Sq Ft | |
| 12/27/2018 12/27/18 | Rented | $1,400 | 0.0% | -- | |
| 12/27/2018 12/27/18 | For Rent | $1,400 | 0.0% | -- | |
| 06/28/2018 06/28/18 | Rented | $1,400 | +3.7% | -- | |
| 06/28/2018 06/28/18 | For Rent | $1,350 | -- | -- |
| Year | Tax Paid | Tax Assessment Tax Assessment Total Assessment is a certain percentage of the fair market value that is determined by local assessors to be the total taxable value of land and additions on the property. | Land | Improvement |
|---|---|---|---|---|
| 2025 | $2,237 | $224,805 | $45,000 | $179,805 |
| 2024 | $2,237 | $224,805 | $45,000 | $179,805 |
| 2023 | $2,237 | $224,805 | $45,000 | $179,805 |
| 2022 | $2,259 | $224,805 | $45,000 | $179,805 |
| 2021 | $1,687 | $154,100 | $40,000 | $114,100 |
| 2020 | $1,687 | $154,100 | $40,000 | $114,100 |
| 2019 | $1,695 | $154,100 | $40,000 | $114,100 |
| 2018 | $1,711 | $154,100 | $40,000 | $114,100 |
| 2017 | $1,769 | $162,300 | $50,000 | $112,300 |
| 2016 | $1,769 | $162,300 | $0 | $0 |
| 2015 | $1,769 | $162,300 | $0 | $0 |
| 2014 | $1,769 | $162,300 | $0 | $0 |
Seller's Agent in 2023
Charles Turner
SeaShore Realty Group, Inc.
(910) 328-3400
13 in this area
36 Total Sales
J
Buyer's Agent in 2023
Jessica Foley
Realty One Group Affinity
(603) 491-9887
1 in this area
18 Total Sales
Buyer's Agent in 2022
Scott Damsell
HomeSmart Connections
(603) 498-6041
44 Total Sales
Buyer's Agent in 2021
Jason Hyde
SeaShore Realty Group, Inc.
(910) 330-7536
2 in this area
66 Total Sales
Source: Hive MLS
MLS Number: 100367037
APN: 072292
Disclaimer: Certain information contained herein is derived from information provided by parties other than Homes.com. All information provided is deemed reliable, but is not guaranteed to be accurate and should be independently verified.
![]() The data relating to real estate on this web site comes in part from the Internet Data Exchange program of Hive MLS LLC. All information is deemed reliable but not guaranteed and should be independently verified. All properties are subject to prior sale, change, or withdrawal. Neither listing broker(s) nor Homesnap, Inc. shall be responsible for any typographical errors, misinformation, or misprints, and shall be held totally harmless from any damages arising from reliance upon these data. ©2025 Hive MLS LLC
The data relating to real estate on this web site comes in part from the Internet Data Exchange program of Hive MLS LLC. All information is deemed reliable but not guaranteed and should be independently verified. All properties are subject to prior sale, change, or withdrawal. Neither listing broker(s) nor Homesnap, Inc. shall be responsible for any typographical errors, misinformation, or misprints, and shall be held totally harmless from any damages arising from reliance upon these data. ©2025 Hive MLS LLC