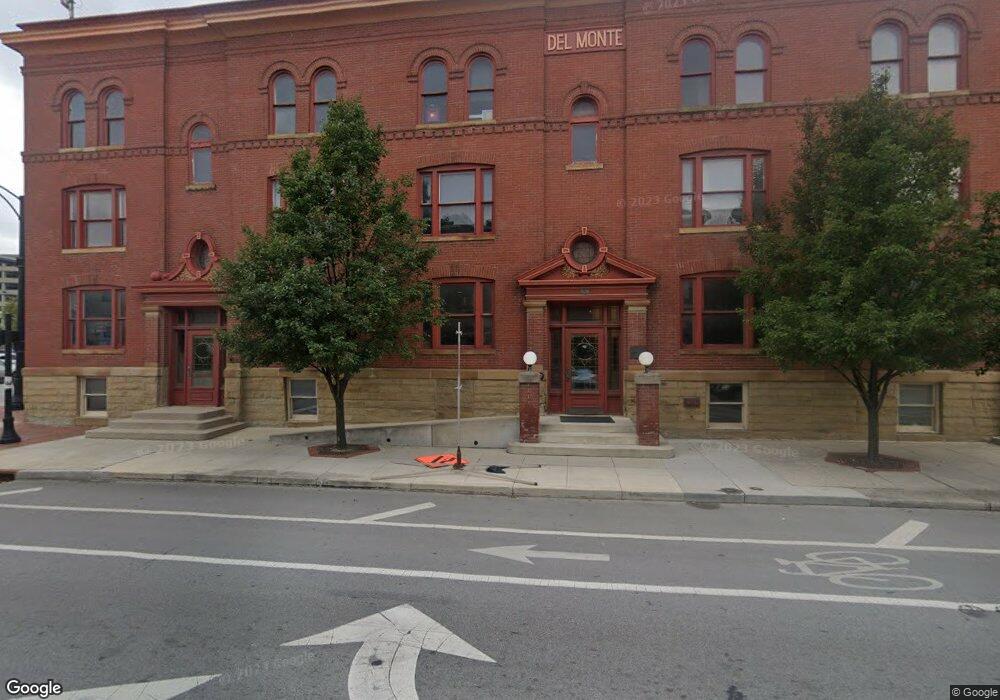
341 S 3rd St Columbus, OH 43215
Uptown District Neighborhood
Studio
--
Bath
23,342
Sq Ft
11,761
Sq Ft Lot
About This Home
This home is located at 341 S 3rd St, Columbus, OH 43215. 341 S 3rd St is a home located in Franklin County with nearby schools including Ohio Avenue Elementary School, Champion Middle School, and East High School.
Ownership History
Date
Name
Owned For
Owner Type
Purchase Details
Closed on
Dec 23, 2015
Sold by
Turkey Run Inc
Bought by
Del Monte Llc
Home Financials for this Owner
Home Financials are based on the most recent Mortgage that was taken out on this home.
Original Mortgage
$900,000
Outstanding Balance
$707,373
Interest Rate
3.93%
Mortgage Type
Commercial
Purchase Details
Closed on
Nov 15, 2005
Sold by
Schott Venture Ltd
Bought by
Turkey Run Inc
Home Financials for this Owner
Home Financials are based on the most recent Mortgage that was taken out on this home.
Original Mortgage
$1,750,000
Interest Rate
5.98%
Mortgage Type
Commercial
Purchase Details
Closed on
Dec 29, 2003
Sold by
Del Monte Lp
Bought by
Schott Ventures Ltd
Home Financials for this Owner
Home Financials are based on the most recent Mortgage that was taken out on this home.
Original Mortgage
$1,400,000
Interest Rate
5.84%
Mortgage Type
Commercial
Purchase Details
Closed on
Jun 1, 1984
Bought by
Delmonte Ltd
Purchase Details
Closed on
Feb 1, 1984
Create a Home Valuation Report for This Property
The Home Valuation Report is an in-depth analysis detailing your home's value as well as a comparison with similar homes in the area
Home Values in the Area
Average Home Value in this Area
Purchase History
| Date | Buyer | Sale Price | Title Company |
|---|---|---|---|
| Del Monte Llc | $1,300,000 | Amerititle | |
| Turkey Run Inc | $3,415,000 | Fati | |
| Schott Ventures Ltd | -- | Midland Celtic Title | |
| Delmonte Ltd | -- | -- | |
| -- | $350,000 | -- |
Source: Public Records
Mortgage History
| Date | Status | Borrower | Loan Amount |
|---|---|---|---|
| Open | Del Monte Llc | $900,000 | |
| Previous Owner | Turkey Run Inc | $1,750,000 | |
| Previous Owner | Schott Ventures Ltd | $1,400,000 |
Source: Public Records
Tax History
| Year | Tax Paid | Tax Assessment Tax Assessment Total Assessment is a certain percentage of the fair market value that is determined by local assessors to be the total taxable value of land and additions on the property. | Land | Improvement |
|---|---|---|---|---|
| 2025 | $36,843 | $461,520 | $246,090 | $215,430 |
| 2024 | $36,843 | $461,520 | $246,090 | $215,430 |
| 2023 | $36,751 | $461,510 | $246,085 | $215,425 |
| 2022 | $36,452 | $449,480 | $124,080 | $325,400 |
| 2021 | $37,056 | $449,480 | $124,080 | $325,400 |
| 2020 | $36,364 | $449,480 | $124,080 | $325,400 |
| 2019 | $36,399 | $408,630 | $112,810 | $295,820 |
| 2018 | $41,388 | $408,630 | $112,810 | $295,820 |
| 2017 | $36,361 | $408,630 | $112,810 | $295,820 |
| 2016 | $36,194 | $391,130 | $112,810 | $278,320 |
| 2015 | $46,485 | $548,630 | $112,810 | $435,820 |
| 2014 | $44,309 | $548,630 | $112,810 | $435,820 |
| 2013 | $23,032 | $548,625 | $112,805 | $435,820 |
Source: Public Records
Map
Nearby Homes
- 112 E Mound St Unit 1
- 115 E Noble St Unit 3
- 309 S 4th St
- 150 E Main St Unit 605
- 150 E Main St Unit 409
- 150 E Main St Unit 301
- 496 S 3rd St
- 169 E Livingston Ave
- 199 S 5th St Unit 301
- 199 S 5th St Unit 405
- 199 S 5th St Unit 406
- 199 S 5th St Unit 502
- 518 Mohawk St Unit 518
- 173 S Front St Unit 173SF
- 93 W Town St Unit 93WT
- 155 W Main St Unit 1105
- 155 W Main St Unit 1205
- 155 W Main St Unit 802
- 155 W Main St Unit 1901
- 570 S Front St Unit 312
- 338 S 3rd St Unit 338-2
- 338 S 3rd St
- 338 S 3rd St Unit 1
- 338 S 3rd St Unit 3
- 338 S 3rd St Unit 2
- 334 S 3rd St Unit 1
- 334 S 3rd St Unit 3
- 334 S 3rd St
- 332 S 3rd St Unit 2
- 332 S 3rd St Unit 1
- 332 S 3rd St Unit 3
- 330 S 3rd St Unit 2
- 330 S 3rd St Unit 1
- 330 S 3rd St Unit 3
- 326 S 3rd St Unit 1
- 326 S 3rd St
- 326 S 3rd St Unit 326-2
- 326 S 3rd St Unit 2
- 328 S 3rd St Unit 2
- 328 S 3rd St Unit 3
Your Personal Tour Guide
Ask me questions while you tour the home.