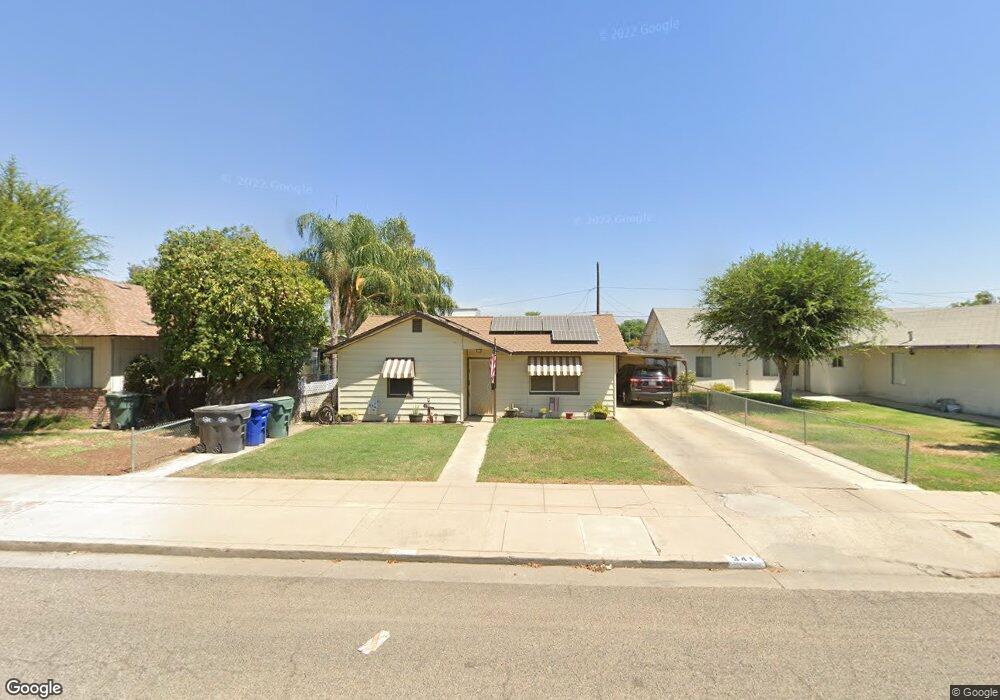
341 S I St Exeter, CA 93221
Estimated Value: $194,109 - $273,000
About This Home
This home is located at 341 S I St, Exeter, CA 93221 and is currently estimated at $237,027, approximately $285 per square foot. 341 S I St is a home located in Tulare County with nearby schools including Sierra View Junior Academy.
Ownership History
We collect this data history from publicly available records. To have your information removed, we recommend requesting removal directly through your county’s website.
Purchase Details
Home Financials for this Owner
Home Financials are based on the most recent Mortgage that was taken out on this home.Purchase Details
Home Values in the Area
Average Home Value in this Area
Purchase History
We collect this data history from publicly available records. To have your information removed, we recommend requesting removal directly through your county’s website.
| Date | Buyer | Sale Price | Title Company |
|---|---|---|---|
| $79,000 | Fidelity National Title Co | ||
| -- | -- |
Mortgage History
We collect this data history from publicly available records. To have your information removed, we recommend requesting removal directly through your county’s website.
| Date | Status | Borrower | Loan Amount |
|---|---|---|---|
| Open | $52,272 | ||
| Closed | $30,000 |
Tax History
We collect this data history from publicly available records. To have your information removed, we recommend requesting removal directly through your county’s website.
| Year | Tax Paid | Tax Assessment Tax Assessment Total Assessment is a certain percentage of the fair market value that is determined by local assessors to be the total taxable value of land and additions on the property. | Land | Improvement |
|---|---|---|---|---|
| 2025 | $1,236 | $112,322 | $42,652 | $69,670 |
| 2024 | $1,236 | $110,120 | $41,816 | $68,304 |
| 2023 | $1,204 | $107,962 | $40,997 | $66,965 |
| 2022 | $1,179 | $105,846 | $40,194 | $65,652 |
| 2021 | $1,170 | $103,771 | $39,406 | $64,365 |
| 2020 | $1,153 | $102,707 | $39,002 | $63,705 |
| 2019 | $1,123 | $100,693 | $38,237 | $62,456 |
| 2018 | $1,069 | $98,718 | $37,487 | $61,231 |
| 2017 | $1,021 | $93,000 | $23,000 | $70,000 |
| 2016 | $933 | $87,000 | $22,000 | $65,000 |
| 2015 | $704 | $84,000 | $21,000 | $63,000 |
| 2014 | $704 | $64,000 | $16,000 | $48,000 |
Map
- Ave 276 Avenue 276
- 447 W Maple St
- 142 S Filbert Rd
- 524 Gearey Ave
- 241 S F St
- 125 S Orange Ave
- 231 S F St
- 103 E Firebaugh Ave
- 618 Birdsong Ct
- 137 N H St
- 700 W Pine St
- 632 Birdsong Ct
- 710 Olivewood Dr
- 220 S D St
- 481 Katelyn Ct
- 301 N G St
- 715 S Kaweah Ave Unit 9
- 506 S Francis Ave
- 508 S Francis Ave
- 313 S C St
Ask me questions while you tour the home.