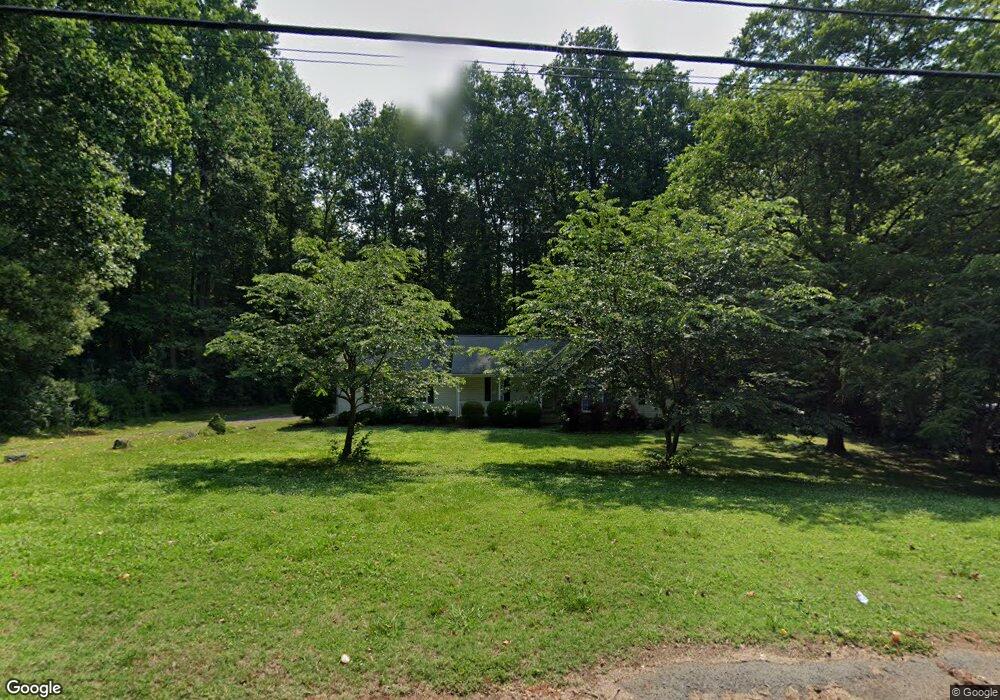
341 S Main St New London, NC 28127
Estimated Value: $236,576 - $282,000
3
Beds
2
Baths
1,176
Sq Ft
$214/Sq Ft
Est. Value
About This Home
This home is located at 341 S Main St, New London, NC 28127 and is currently estimated at $252,144, approximately $214 per square foot. 341 S Main St is a home with nearby schools including Richfield Elementary School, North Stanly Middle School, and North Stanly High School.
Ownership History
Date
Name
Owned For
Owner Type
Purchase Details
Closed on
Nov 21, 2023
Sold by
Fisher John L
Bought by
Buck Randy
Current Estimated Value
Purchase Details
Closed on
Feb 20, 2008
Sold by
Smith Katrina H and Smith Trina H
Bought by
Fisher John L and Fisher Beverly R
Purchase Details
Closed on
Sep 26, 2005
Sold by
Meacham Eloise C
Bought by
Smith Trina H
Create a Home Valuation Report for This Property
The Home Valuation Report is an in-depth analysis detailing your home's value as well as a comparison with similar homes in the area
Home Values in the Area
Average Home Value in this Area
Purchase History
| Date | Buyer | Sale Price | Title Company |
|---|---|---|---|
| Buck Randy | $200,000 | None Listed On Document | |
| Fisher John L | -- | None Available | |
| Smith Trina H | $11,000 | None Available |
Source: Public Records
Tax History Compared to Growth
Tax History
| Year | Tax Paid | Tax Assessment Tax Assessment Total Assessment is a certain percentage of the fair market value that is determined by local assessors to be the total taxable value of land and additions on the property. | Land | Improvement |
|---|---|---|---|---|
| 2025 | $1,305 | $175,157 | $24,796 | $150,361 |
| 2024 | $1,153 | $136,427 | $19,386 | $117,041 |
| 2023 | $1,153 | $136,427 | $19,386 | $117,041 |
| 2022 | $1,153 | $136,427 | $19,386 | $117,041 |
| 2021 | $1,153 | $136,427 | $19,386 | $117,041 |
| 2020 | $1,101 | $122,849 | $17,583 | $105,266 |
| 2019 | $1,112 | $122,849 | $17,583 | $105,266 |
| 2018 | $1,112 | $122,849 | $17,583 | $105,266 |
| 2017 | $1,112 | $122,849 | $17,583 | $105,266 |
| 2016 | $1,083 | $119,682 | $15,779 | $103,903 |
| 2015 | $1,094 | $119,682 | $15,779 | $103,903 |
| 2014 | $968 | $119,682 | $15,779 | $103,903 |
Source: Public Records
Map
Nearby Homes
- 232 E Gold St
- 00 N Carolina 740
- 247 N Main St
- 00 Herlocker Rd
- 0 Hearne Rd
- Lot 486 Skyline Dr
- 38692 Smoke Ridge Rd
- 44401 U S 52
- 31655 Pinewood Dr
- 44097 Nc 740 Hwy
- 36984 B&C Carter Rd
- 44434 U S 52
- 44389 U S 52
- 36433 Azalea Cir
- 38037 Mountain Creek Rd
- 40149 Eagle Head Ct
- 2812 Highway 52
- 42765 Caudle Rd
- 2810 Greenwood Park Cir
- 2808 Murdock Ln