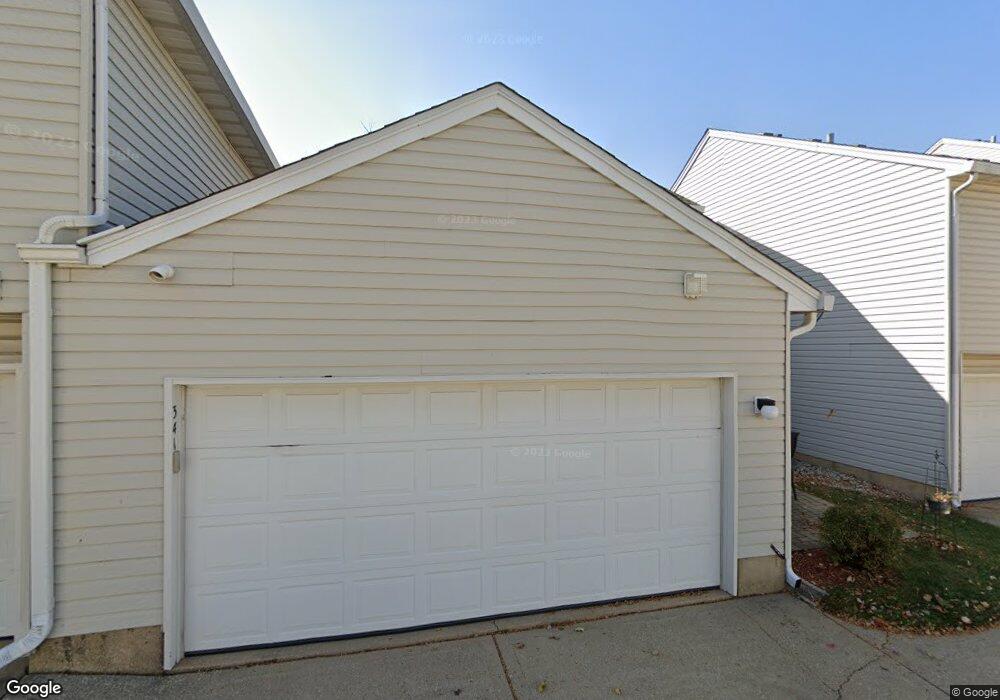
341 Springmist Ct Unit O Bolingbrook, IL 60440
East Bolingbrook NeighborhoodEstimated Value: $237,000 - $275,000
3
Beds
2
Baths
1,282
Sq Ft
$199/Sq Ft
Est. Value
About This Home
This home is located at 341 Springmist Ct Unit O, Bolingbrook, IL 60440 and is currently estimated at $255,410, approximately $199 per square foot. 341 Springmist Ct Unit O is a home located in Will County with nearby schools including Oak View Elementary School, Bolingbrook High School, and Midwest Christian Montessori Academy.
Ownership History
Date
Name
Owned For
Owner Type
Purchase Details
Closed on
Oct 25, 2007
Sold by
Buckley Lee Dianne
Bought by
Staggs Renee
Current Estimated Value
Home Financials for this Owner
Home Financials are based on the most recent Mortgage that was taken out on this home.
Original Mortgage
$171,000
Outstanding Balance
$108,036
Interest Rate
6.44%
Mortgage Type
Purchase Money Mortgage
Estimated Equity
$147,374
Purchase Details
Closed on
Feb 24, 2001
Sold by
Moore Michael J
Bought by
Buckley Lee Diane
Home Financials for this Owner
Home Financials are based on the most recent Mortgage that was taken out on this home.
Original Mortgage
$132,600
Interest Rate
7.03%
Mortgage Type
VA
Purchase Details
Closed on
Dec 6, 2000
Sold by
Hud
Bought by
Moore Michael J
Purchase Details
Closed on
Mar 3, 2000
Sold by
Odonnell John D and Nationsbanc Mtg Corp
Bought by
Hud
Purchase Details
Closed on
May 27, 1997
Sold by
The Bigelow Group Inc
Bought by
Odonnell John D
Home Financials for this Owner
Home Financials are based on the most recent Mortgage that was taken out on this home.
Original Mortgage
$131,000
Interest Rate
8.27%
Mortgage Type
FHA
Create a Home Valuation Report for This Property
The Home Valuation Report is an in-depth analysis detailing your home's value as well as a comparison with similar homes in the area
Home Values in the Area
Average Home Value in this Area
Purchase History
| Date | Buyer | Sale Price | Title Company |
|---|---|---|---|
| Staggs Renee | $180,000 | None Available | |
| Buckley Lee Diane | $130,000 | Stewart Title Company | |
| Moore Michael J | -- | Stewart Title Company | |
| Hud | -- | -- | |
| Odonnell John D | $135,500 | -- |
Source: Public Records
Mortgage History
| Date | Status | Borrower | Loan Amount |
|---|---|---|---|
| Open | Staggs Renee | $171,000 | |
| Previous Owner | Buckley Lee Diane | $132,600 | |
| Previous Owner | Odonnell John D | $131,000 |
Source: Public Records
Tax History
| Year | Tax Paid | Tax Assessment Tax Assessment Total Assessment is a certain percentage of the fair market value that is determined by local assessors to be the total taxable value of land and additions on the property. | Land | Improvement |
|---|---|---|---|---|
| 2024 | $5,560 | $68,201 | $20,724 | $47,477 |
| 2023 | $5,560 | $61,365 | $18,647 | $42,718 |
| 2022 | $4,768 | $54,238 | $16,481 | $37,757 |
| 2021 | $4,502 | $50,713 | $15,410 | $35,303 |
| 2020 | $4,354 | $49,045 | $14,903 | $34,142 |
| 2019 | $4,106 | $45,793 | $13,915 | $31,878 |
| 2018 | $3,752 | $42,127 | $12,801 | $29,326 |
| 2017 | $3,357 | $38,029 | $11,556 | $26,473 |
| 2016 | $3,243 | $36,200 | $11,000 | $25,200 |
| 2015 | $4,243 | $33,700 | $10,200 | $23,500 |
| 2014 | $4,243 | $31,800 | $9,600 | $22,200 |
| 2013 | $4,243 | $45,400 | $13,700 | $31,700 |
Source: Public Records
Map
Nearby Homes
- 372 Windsong Ct Unit 4110
- 80 Fernwood Dr Unit O
- 10 Fernwood Dr Unit L
- 5 E Fernwood Dr
- 450 Lily Cache Ln
- 209 Mill Stream Dr
- 226 Grant Dr
- 426 Greentree Ln Unit 6
- 127 Monticello Cir
- 209 Bunker Hill Dr
- 528 Alcott Ln
- 164 Galewood Dr
- 160 Galewood Dr
- 548 Larkspur Dr
- 103 Enclave Cir Unit C
- 230 Delaware Dr
- 118 Springleaf Dr Unit 5
- 408 Colony Ct Unit 4
- 401 Salem Square
- 112 Brook Ct
- 365 Springmist Ct Unit 8
- 353 Springmist Ct Unit 405
- 341 Springmist Ct Unit 402
- 349 Springmist Ct Unit 40/04
- 373 Springmist Ct Unit 4010
- 337 Springmist Ct Unit 401
- 357 Springmist Ct Unit 406
- 369 Springmist Ct Unit 409
- 377 Springmist Ct Unit 40/11
- 361 Springmist Ct Unit 40/07
- 373 Springmist Ct Unit 373
- 345 Springmist Ct Unit 4003
- 374 Springmist Ct Unit 10
- 358 Springmist Ct Unit 6
- 350 Springmist Ct Unit 4
- 338 Springmist Ct
- 354 Springmist Ct Unit 395
- 362 Springmist Ct Unit 39/7
- 366 Springmist Ct Unit 8
- 378 Springmist Ct Unit 39/11
Your Personal Tour Guide
Ask me questions while you tour the home.