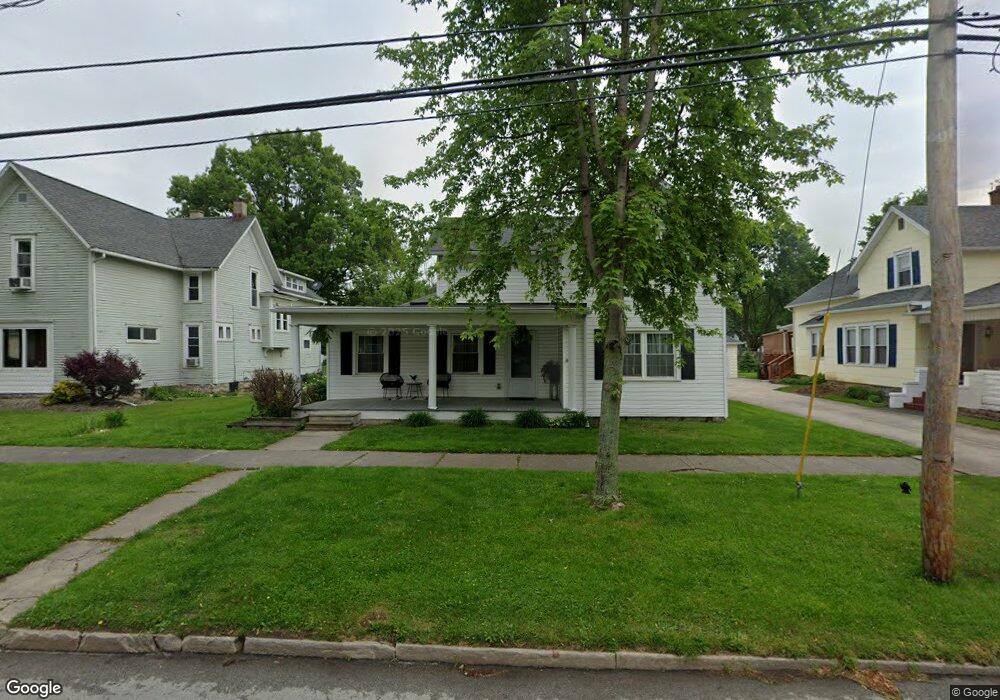
341 Toledo St Elmore, OH 43416
Estimated Value: $183,000 - $210,000
4
Beds
2
Baths
2,074
Sq Ft
$97/Sq Ft
Est. Value
About This Home
This home is located at 341 Toledo St, Elmore, OH 43416 and is currently estimated at $200,244, approximately $96 per square foot. 341 Toledo St is a home located in Ottawa County with nearby schools including Woodmore Elementary School and Woodmore Middle School.
Ownership History
Date
Name
Owned For
Owner Type
Purchase Details
Closed on
May 3, 2019
Sold by
Oak Ridge Rentals Llc
Bought by
Ramirez Anthony T
Current Estimated Value
Home Financials for this Owner
Home Financials are based on the most recent Mortgage that was taken out on this home.
Original Mortgage
$121,164
Outstanding Balance
$107,920
Interest Rate
4.87%
Mortgage Type
FHA
Estimated Equity
$92,324
Purchase Details
Closed on
Aug 21, 2008
Sold by
Manufacturers & Traders Trust Company
Bought by
Oak Ridge Rentals Llc
Home Financials for this Owner
Home Financials are based on the most recent Mortgage that was taken out on this home.
Original Mortgage
$75,000
Interest Rate
6.55%
Mortgage Type
Future Advance Clause Open End Mortgage
Purchase Details
Closed on
May 10, 2007
Sold by
Heilman Carol J
Bought by
Manufacturers & Traders Trust Co and Home Equity Loan Pass Through Certificat
Create a Home Valuation Report for This Property
The Home Valuation Report is an in-depth analysis detailing your home's value as well as a comparison with similar homes in the area
Home Values in the Area
Average Home Value in this Area
Purchase History
| Date | Buyer | Sale Price | Title Company |
|---|---|---|---|
| Ramirez Anthony T | $123,400 | None Available | |
| Oak Ridge Rentals Llc | $30,000 | Attorney | |
| Manufacturers & Traders Trust Co | $50,000 | Accommodation |
Source: Public Records
Mortgage History
| Date | Status | Borrower | Loan Amount |
|---|---|---|---|
| Open | Ramirez Anthony T | $121,164 | |
| Previous Owner | Oak Ridge Rentals Llc | $75,000 |
Source: Public Records
Tax History Compared to Growth
Tax History
| Year | Tax Paid | Tax Assessment Tax Assessment Total Assessment is a certain percentage of the fair market value that is determined by local assessors to be the total taxable value of land and additions on the property. | Land | Improvement |
|---|---|---|---|---|
| 2024 | $2,779 | $51,296 | $9,961 | $41,335 |
| 2023 | $2,779 | $42,970 | $7,378 | $35,592 |
| 2022 | $2,519 | $42,970 | $7,378 | $35,592 |
| 2021 | $2,538 | $42,980 | $7,380 | $35,600 |
| 2020 | $2,339 | $37,570 | $7,380 | $30,190 |
| 2019 | $2,311 | $37,570 | $7,380 | $30,190 |
| 2018 | $2,089 | $34,350 | $7,380 | $26,970 |
| 2017 | $1,928 | $31,500 | $7,380 | $24,120 |
| 2016 | $1,885 | $31,500 | $7,380 | $24,120 |
| 2015 | $2,005 | $31,500 | $7,380 | $24,120 |
| 2014 | $1,979 | $30,190 | $7,380 | $22,810 |
| 2013 | $4,124 | $30,190 | $7,380 | $22,810 |
Source: Public Records
Map
Nearby Homes
- 0 W Portage River Rd S Unit 6130453
- 19383 Courtland Ave
- 20240 W Portage River South Rd
- 620 Water St
- 6201 County Highway 165
- 212 S Perry St
- 219 Lime St
- 612 W Main St
- 2574 County Road 74
- 205 W 4th St
- 739 Riverside Dr
- 421 Parklane Dr
- 514 West St
- 571 Parklane Dr
- 904 Main St
- 207 E 11th St
- 1350 N Genoa Clay Center Rd
- 14878 W State Route 163
- 510 Wilson St
- 1861 N Opfer-Lentz Rd