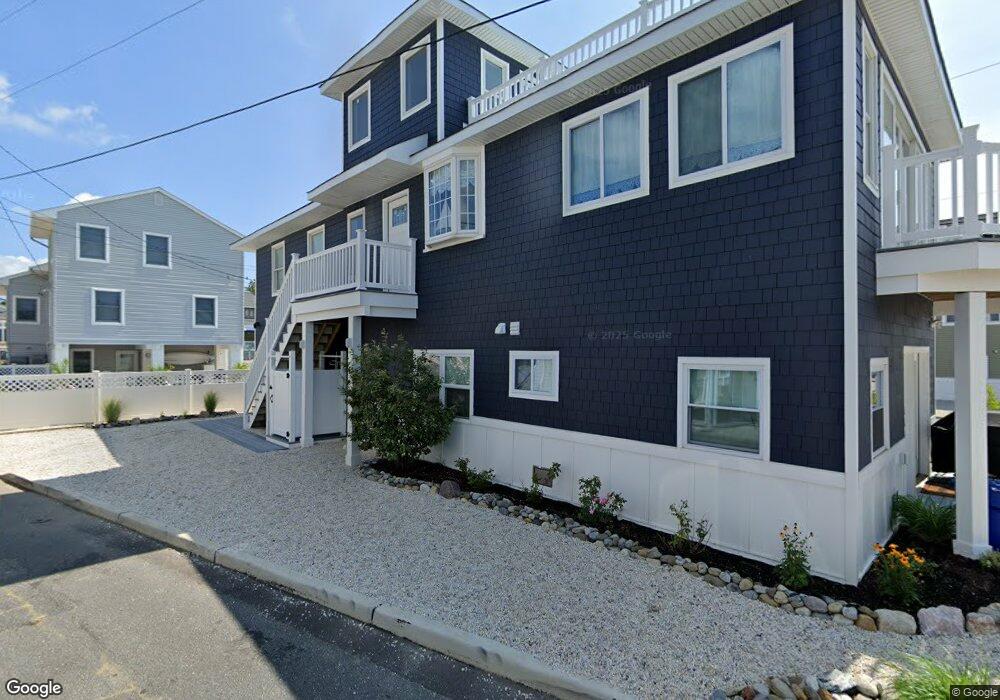
341 W 17th St Ship Bottom, NJ 08008
Long Beach Island NeighborhoodEstimated Value: $767,000 - $1,258,927
3
Beds
1
Bath
680
Sq Ft
$1,546/Sq Ft
Est. Value
About This Home
This home is located at 341 W 17th St, Ship Bottom, NJ 08008 and is currently estimated at $1,051,482, approximately $1,546 per square foot. 341 W 17th St is a home located in Ocean County with nearby schools including Ethel A. Jacobsen Elementary School, Long Beach Island Grade School, and Southern Regional Middle School.
Ownership History
Date
Name
Owned For
Owner Type
Purchase Details
Closed on
Oct 8, 2008
Sold by
Cranmer Robert and Cranmer Catherine
Bought by
Dioguardi John and Dioguardi Camille
Current Estimated Value
Home Financials for this Owner
Home Financials are based on the most recent Mortgage that was taken out on this home.
Original Mortgage
$333,600
Outstanding Balance
$221,624
Interest Rate
6.41%
Mortgage Type
Purchase Money Mortgage
Estimated Equity
$829,858
Purchase Details
Closed on
Mar 9, 2006
Sold by
Reeves Steve
Bought by
Cranmer Catherine
Home Financials for this Owner
Home Financials are based on the most recent Mortgage that was taken out on this home.
Original Mortgage
$332,500
Interest Rate
6.15%
Mortgage Type
Stand Alone First
Purchase Details
Closed on
Oct 30, 1998
Sold by
Pauk George L
Bought by
Reeves Steve
Home Financials for this Owner
Home Financials are based on the most recent Mortgage that was taken out on this home.
Original Mortgage
$94,500
Interest Rate
11.5%
Create a Home Valuation Report for This Property
The Home Valuation Report is an in-depth analysis detailing your home's value as well as a comparison with similar homes in the area
Home Values in the Area
Average Home Value in this Area
Purchase History
| Date | Buyer | Sale Price | Title Company |
|---|---|---|---|
| Dioguardi John | $420,000 | None Available | |
| Cranmer Catherine | $475,000 | Chicago Title Insurance Co | |
| Reeves Steve | $135,000 | -- |
Source: Public Records
Mortgage History
| Date | Status | Borrower | Loan Amount |
|---|---|---|---|
| Open | Dioguardi John | $333,600 | |
| Previous Owner | Cranmer Catherine | $332,500 | |
| Previous Owner | Reeves Steve | $94,500 |
Source: Public Records
Tax History Compared to Growth
Tax History
| Year | Tax Paid | Tax Assessment Tax Assessment Total Assessment is a certain percentage of the fair market value that is determined by local assessors to be the total taxable value of land and additions on the property. | Land | Improvement |
|---|---|---|---|---|
| 2025 | $9,211 | $764,400 | $408,300 | $356,100 |
| 2024 | $8,783 | $764,400 | $408,300 | $356,100 |
| 2023 | $8,095 | $764,400 | $408,300 | $356,100 |
| 2022 | $8,095 | $764,400 | $408,300 | $356,100 |
| 2021 | $5,117 | $485,500 | $408,300 | $77,200 |
| 2020 | $5,132 | $485,500 | $408,300 | $77,200 |
| 2019 | $5,137 | $485,500 | $408,300 | $77,200 |
| 2018 | $5,146 | $485,500 | $408,300 | $77,200 |
| 2017 | $4,811 | $485,500 | $408,300 | $77,200 |
| 2016 | $5,394 | $487,300 | $402,100 | $85,200 |
| 2015 | $5,263 | $487,300 | $402,100 | $85,200 |
| 2014 | $5,258 | $487,300 | $402,100 | $85,200 |
Source: Public Records
Map
Nearby Homes
- 1306 Barnegat Ave
- 1810 Central Ave Unit 15
- 1810 Central Ave Unit 17
- 111 W 18th St Unit 2
- 1903 Pennsylvania Ave
- 2109 Central Ave
- 108 W 10th St
- 2 Northeast Dr
- 1219 Long Beach Blvd
- 615 Barnegat Ave
- 2572 E East Bay Ave
- 1001 Ocean Ave Unit 1017
- 1001 Ocean Ave Unit 1012
- 401 Boulevard Unit 306
- 401 Boulevard Unit 506
- 401 Boulevard Unit 503
- 401 Boulevard Unit 205
- 401 Boulevard Unit 202
- 249 S 2nd St
- 11 S 3rd St
- 1615 Bay Terrace
- 1613 E Bay Terrace
- 333 W 17th St
- 1609 E Bay Terrace
- 344 W 16th St
- 1605 E Bay Terrace
- 334 W 16th St
- 1701 Bay Terrace
- 325 W 17th St
- 1701 Bay Terrace
- 1701 Bay Terrace
- 1703 Bay Terrace
- 1601 E Bay Terrace
- 1705 Bay Terrace
- 1707 Bay Terrace
- 336 W 17th St
- 328 W 16th St
- 321 W 17th St
- 334 W 17th St
- 1709 Bay Terrace