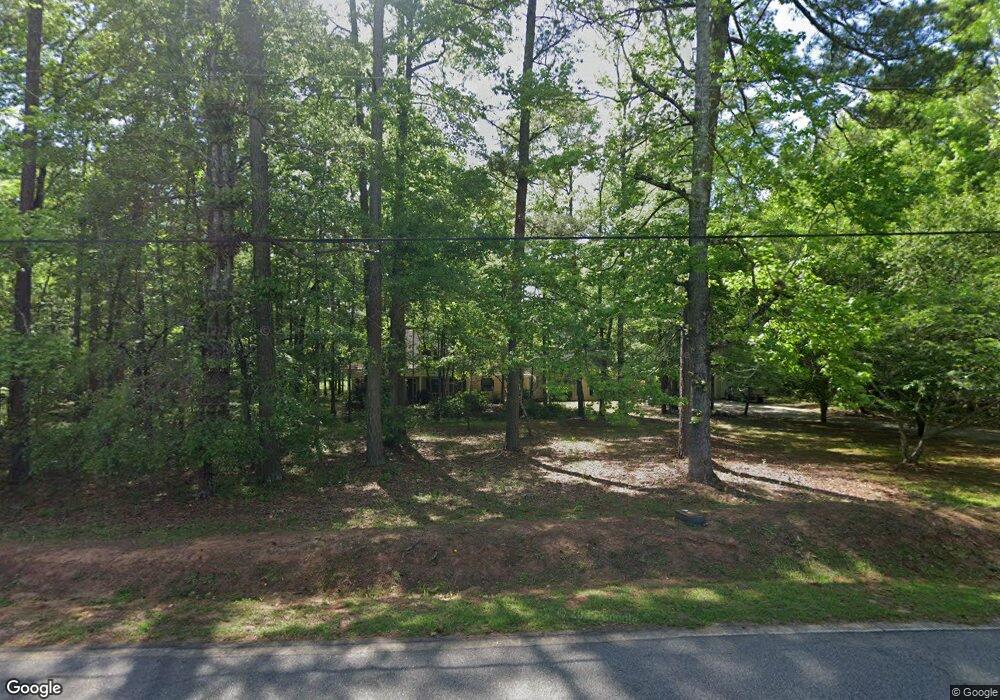
341 Williamson Dr Unit 6 Williamson, GA 30292
Estimated Value: $404,191 - $521,000
Studio
3
Baths
2,654
Sq Ft
$166/Sq Ft
Est. Value
About This Home
This home is located at 341 Williamson Dr Unit 6, Williamson, GA 30292 and is currently estimated at $440,298, approximately $165 per square foot. 341 Williamson Dr Unit 6 is a home located in Pike County with nearby schools including Pike County Primary School, Pike County Elementary School, and Pike County Middle School.
Ownership History
Date
Name
Owned For
Owner Type
Purchase Details
Closed on
Dec 22, 2006
Sold by
Barnes Terry
Bought by
Barnes Marvin T
Current Estimated Value
Home Financials for this Owner
Home Financials are based on the most recent Mortgage that was taken out on this home.
Original Mortgage
$278,800
Outstanding Balance
$162,171
Interest Rate
6.1%
Mortgage Type
New Conventional
Estimated Equity
$278,127
Purchase Details
Closed on
May 25, 2006
Sold by
Barnes Terry
Bought by
Barnes Terry
Purchase Details
Closed on
Aug 25, 1994
Sold by
Graham Cathy Pitts
Bought by
Barnes Terry and Barnes Anne J
Purchase Details
Closed on
Mar 14, 1994
Sold by
Graham Kenneth
Bought by
Graham Cathy Pitts
Purchase Details
Closed on
Feb 15, 1990
Sold by
Crouch Cathy Pitts
Bought by
Graham Cathy Pitts and Graham Kenneth
Purchase Details
Closed on
Jan 24, 1985
Sold by
Harrison Bobby J Etal
Bought by
Crouch Cathy Pitts
Purchase Details
Closed on
Nov 1, 1972
Bought by
Harrison Bobby J Etal
Create a Home Valuation Report for This Property
The Home Valuation Report is an in-depth analysis detailing your home's value as well as a comparison with similar homes in the area
Purchase History
| Date | Buyer | Sale Price | Title Company |
|---|---|---|---|
| Barnes Marvin T | -- | -- | |
| Barnes Terry | -- | -- | |
| Barnes Terry | $136,000 | -- | |
| Graham Cathy Pitts | -- | -- | |
| Graham Cathy Pitts | -- | -- | |
| Crouch Cathy Pitts | $4,500 | -- | |
| Harrison Bobby J Etal | -- | -- |
Source: Public Records
Mortgage History
| Date | Status | Borrower | Loan Amount |
|---|---|---|---|
| Open | Barnes Marvin T | $278,800 | |
| Closed | Barnes Marvin T | $50,000 |
Source: Public Records
Tax History
| Year | Tax Paid | Tax Assessment Tax Assessment Total Assessment is a certain percentage of the fair market value that is determined by local assessors to be the total taxable value of land and additions on the property. | Land | Improvement |
|---|---|---|---|---|
| 2025 | $3,158 | $136,819 | $15,665 | $121,154 |
| 2024 | $3,375 | $124,157 | $12,545 | $111,612 |
| 2023 | $4,034 | $124,157 | $12,545 | $111,612 |
| 2022 | $2,950 | $90,803 | $12,545 | $78,258 |
| 2021 | $2,829 | $84,443 | $6,185 | $78,258 |
| 2020 | $2,866 | $84,443 | $6,185 | $78,258 |
| 2019 | $2,526 | $65,057 | $6,185 | $58,872 |
| 2018 | $2,531 | $65,057 | $6,185 | $58,872 |
| 2017 | $2,514 | $65,057 | $6,185 | $58,872 |
| 2016 | $2,463 | $68,031 | $6,185 | $61,846 |
| 2015 | $2,361 | $68,031 | $6,185 | $61,846 |
| 2014 | $2,390 | $68,031 | $6,185 | $61,846 |
| 2013 | -- | $68,031 | $6,184 | $61,846 |
Source: Public Records
Map
Nearby Homes
- 752 Jonathans Roost Rd
- 119 Little St
- 115 Little St
- 404 Whipple Ave
- 933 Ashley Glen Dr
- 0 Windsor Ct Unit LOT 25 10585833
- 190 Roundtree Way
- 1037 Ashley Glen Dr
- 1946 Highway 362 W
- 19 Chatham Ct
- 766 Wisteria Ln Unit 55
- 79 Huntington Way
- 0 Wisteria Ln Unit 80
- 1 Wisteria Ln Unit 85
- 0 Wisteria Ln Unit 84
- 208 Ashley Glen Dr
- 0 Conner Ln Unit LOT 32
- 299 Cammie Way Unit LOT 46
- 360 Cammie Way
- 341 Cammie Way Unit LOT 45
- 803 341 Williamson Dr
- 345 Williamson Dr
- 454 Williamson Dr
- 434 Williamson Dr
- 454 Williamson Dr Unit LOT 2
- 271 Williamson Dr
- 406 Williamson Dr
- 421 Williamson Dr
- 109 Williamson Dr Unit 10
- 417 Midland St
- 0 Williamson Dr Unit Lot 2 8972392
- 0 Williamson Dr Unit 8917950
- 110 Williamson Dr
- 415 Midland St
- 52 Williamson Dr
- 165 Williamson Dr
- 127 Williamson Dr
- 461 Williamson Dr Unit L-4
- 461 Williamson Dr
- 204 Windmill Ln
Your Personal Tour Guide
Ask me questions while you tour the home.