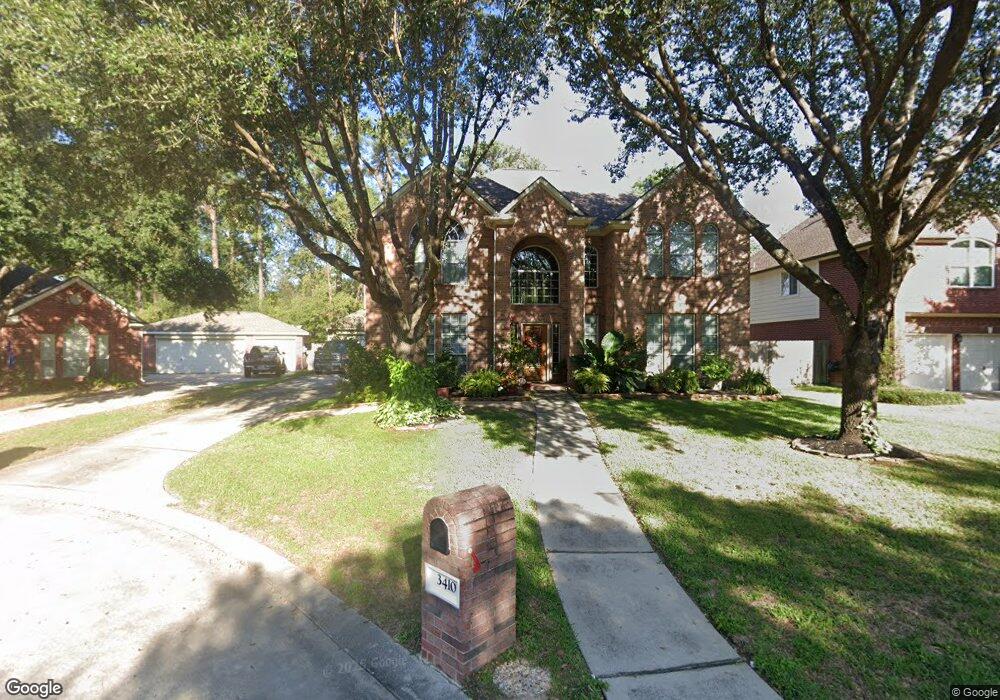
3410 Hackberry Ct Spring, TX 77388
Estimated Value: $407,802 - $454,000
4
Beds
4
Baths
3,442
Sq Ft
$124/Sq Ft
Est. Value
About This Home
This home is located at 3410 Hackberry Ct, Spring, TX 77388 and is currently estimated at $425,451, approximately $123 per square foot. 3410 Hackberry Ct is a home located in Harris County with nearby schools including Haude Elementary School, Strack Intermediate School, and Klein Collins High School.
Ownership History
Date
Name
Owned For
Owner Type
Purchase Details
Closed on
Apr 18, 2012
Sold by
Fannie Mae
Bought by
Frances Phillip A and Frances Paula F
Current Estimated Value
Purchase Details
Closed on
Dec 6, 2011
Sold by
Paschal Rebecca and Paschal Kirk
Bought by
Federal National Mortgage Association and Fannie Mae
Purchase Details
Closed on
Jun 27, 2007
Sold by
Newmark Homes Lp
Bought by
Gracepoint Builders Lp
Home Financials for this Owner
Home Financials are based on the most recent Mortgage that was taken out on this home.
Original Mortgage
$640,486
Interest Rate
6.19%
Mortgage Type
Credit Line Revolving
Purchase Details
Closed on
Oct 1, 2002
Sold by
J Patrick Homes Ltd
Bought by
Paschal Rebecca
Home Financials for this Owner
Home Financials are based on the most recent Mortgage that was taken out on this home.
Original Mortgage
$209,600
Interest Rate
6.26%
Create a Home Valuation Report for This Property
The Home Valuation Report is an in-depth analysis detailing your home's value as well as a comparison with similar homes in the area
Purchase History
| Date | Buyer | Sale Price | Title Company |
|---|---|---|---|
| Frances Phillip A | -- | None Available | |
| Federal National Mortgage Association | $212,559 | None Available | |
| Gracepoint Builders Lp | -- | Chicago Title | |
| Paschal Rebecca | -- | Stewart Title |
Source: Public Records
Mortgage History
| Date | Status | Borrower | Loan Amount |
|---|---|---|---|
| Previous Owner | Gracepoint Builders Lp | $640,486 | |
| Previous Owner | Paschal Rebecca | $209,600 |
Source: Public Records
Tax History
| Year | Tax Paid | Tax Assessment Tax Assessment Total Assessment is a certain percentage of the fair market value that is determined by local assessors to be the total taxable value of land and additions on the property. | Land | Improvement |
|---|---|---|---|---|
| 2025 | $6,963 | $393,101 | $60,968 | $332,133 |
| 2024 | $6,963 | $396,230 | $60,968 | $335,262 |
| 2023 | $6,963 | $405,901 | $60,968 | $344,933 |
| 2022 | $7,170 | $423,706 | $60,968 | $362,738 |
| 2021 | $7,006 | $287,000 | $43,729 | $243,271 |
| 2020 | $6,805 | $230,000 | $43,729 | $186,271 |
| 2019 | $7,096 | $230,000 | $43,729 | $186,271 |
| 2018 | $2,071 | $230,000 | $43,729 | $186,271 |
| 2017 | $14,296 | $230,000 | $43,729 | $186,271 |
| 2016 | $7,521 | $242,000 | $43,729 | $198,271 |
| 2015 | $4,239 | $275,878 | $43,729 | $232,149 |
| 2014 | $4,239 | $224,427 | $43,729 | $180,698 |
Source: Public Records
Map
Nearby Homes
- 3522 Aspen Glen Ln
- 3622 Chessnut Glen Dr
- 3510 Ash Glen Dr
- 2518 Liguria Ln
- 2615 Liguria Ln
- 2615 Piemonte Avenue Cir
- 2523 Liguria
- 2603 Piemonte Ct Ave
- 20206 Treetop Ln
- 3610 Walnut Forest Ln
- 3618 Walnut Forest Ln
- 20131 Forest Dr
- 20806 Deauville Dr
- 0 Kuykendahl Rd Unit 50148573
- 20518 Bonds Creek Ln
- 20831 Deauville Dr
- 3226 Nickwill Way
- 2915 Sandleigh Dr
- 20903 Manon Ln
- 20923 Bayeux Ln
- 3406 Hackberry Ct
- 3414 Hackberry Ct
- 3402 Hackberry Ct
- 3418 Hackberry Ct
- 3411 Hackberry Ct
- 20517 Falvel Rd
- 3407 Hackberry Ct
- 3415 Hackberry Ct
- 3419 Hackberry Ct
- 20434 Long Cypress Dr
- 20518 Treetop Ln
- 20430 Long Cypress Dr
- 20514 Treetop Ln
- 20520 Falvel Rd
- 20519 Falvel Rd
- 20510 Treetop Ln
- 20426 Long Cypress Dr
- 20522 Treetop Ln
- 3410 Stone Ivory Ct
- 3402 Stone Ivory Ct
Your Personal Tour Guide
Ask me questions while you tour the home.