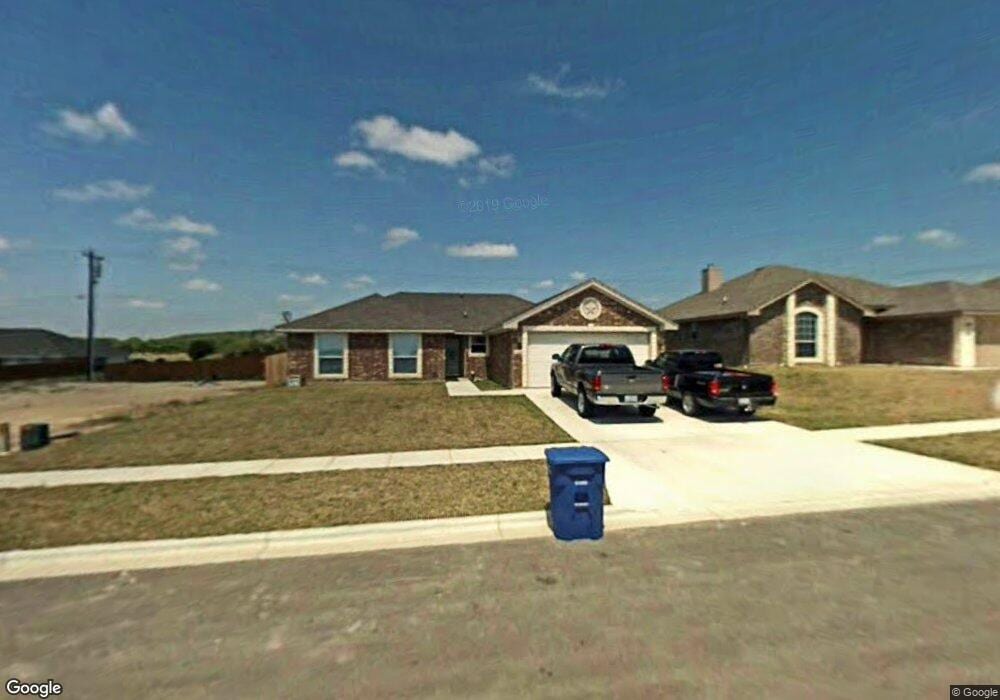
3410 Lauren St Unit D Copperas Cove, TX 76522
Estimated Value: $239,014 - $254,000
4
Beds
2
Baths
1,691
Sq Ft
$146/Sq Ft
Est. Value
About This Home
This home is located at 3410 Lauren St Unit D, Copperas Cove, TX 76522 and is currently estimated at $246,507, approximately $145 per square foot. 3410 Lauren St Unit D is a home located in Coryell County with nearby schools including J.L. Williams/Lovett Ledger Elementary School, S.C. Lee Junior High School, and Copperas Cove High School.
Ownership History
Date
Name
Owned For
Owner Type
Purchase Details
Closed on
Jun 21, 2019
Sold by
Benzinger Williams Alexis N and Williams James R
Bought by
Britt Tyler
Current Estimated Value
Home Financials for this Owner
Home Financials are based on the most recent Mortgage that was taken out on this home.
Original Mortgage
$160,115
Outstanding Balance
$140,780
Interest Rate
4.1%
Mortgage Type
New Conventional
Estimated Equity
$105,727
Purchase Details
Closed on
Dec 21, 2007
Sold by
Neiman Homes And Construction Llc
Bought by
Benzingerwilliams Alexis N and Williams James R
Home Financials for this Owner
Home Financials are based on the most recent Mortgage that was taken out on this home.
Original Mortgage
$144,900
Interest Rate
6.26%
Create a Home Valuation Report for This Property
The Home Valuation Report is an in-depth analysis detailing your home's value as well as a comparison with similar homes in the area
Home Values in the Area
Average Home Value in this Area
Purchase History
| Date | Buyer | Sale Price | Title Company |
|---|---|---|---|
| Britt Tyler | -- | Blackcare Title | |
| Benzingerwilliams Alexis N | -- | -- |
Source: Public Records
Mortgage History
| Date | Status | Borrower | Loan Amount |
|---|---|---|---|
| Open | Britt Tyler | $160,115 | |
| Previous Owner | Benzingerwilliams Alexis N | $144,900 |
Source: Public Records
Tax History Compared to Growth
Tax History
| Year | Tax Paid | Tax Assessment Tax Assessment Total Assessment is a certain percentage of the fair market value that is determined by local assessors to be the total taxable value of land and additions on the property. | Land | Improvement |
|---|---|---|---|---|
| 2025 | $4,788 | $230,940 | $30,000 | $200,940 |
| 2023 | $4,788 | $245,670 | $30,000 | $215,670 |
| 2022 | $4,622 | $206,030 | $30,000 | $176,030 |
| 2021 | $4,228 | $164,040 | $25,000 | $139,040 |
| 2020 | $4,160 | $158,857 | $25,000 | $133,857 |
| 2019 | $4,185 | $154,330 | $25,000 | $129,330 |
| 2018 | $4,028 | $148,450 | $25,000 | $123,450 |
| 2017 | $3,833 | $144,150 | $25,000 | $119,150 |
| 2016 | $3,869 | $145,470 | $25,000 | $120,470 |
| 2015 | $3,668 | $138,950 | $25,000 | $113,950 |
| 2014 | $3,668 | $140,280 | $25,000 | $115,280 |
Source: Public Records
Map
Nearby Homes
- 3402 Lauren St
- 3508 Lucas St
- 3506 Jacob St
- 3422 Doss St
- 3609 Raiford Dr
- 1301 Oak Springs Rd
- 2701 Settlement Rd
- 2807 Grimes Crossing Rd
- 3511 Rock Island St
- 312 Skyline Dr
- 2411 Settlement Rd
- 2509 Heartland Ave
- 812 Taylor Creek Rd
- 2705 Sun Point Cir
- 2907 Wild Horse Cir
- Lot 16a Unit FM 1113
- 5508 County Road 3300
- 0 Fm 1113 Unit 24608993
- 303 Sumac Trail
- 3113 Yaupon Rd
- 3410 Lauren St
- 3408 Lauren St
- 3412 Lauren St
- 3406 Lauren St
- 3414 Lauren St
- 3415 Grimes Crossing Rd
- 3407 Lauren St
- 3409 Lauren St
- 3405 Lauren St
- 3416 Lauren St
- 3404 Lauren St
- 3411 Lauren St
- 3403 Lauren St
- 3409 Grimes Crossing Rd
- 3421 Grimes Crossing Rd
- 3413 Lauren St
- 3502 Lauren St
- 3408 Lucas St
- 3406 Lucas St