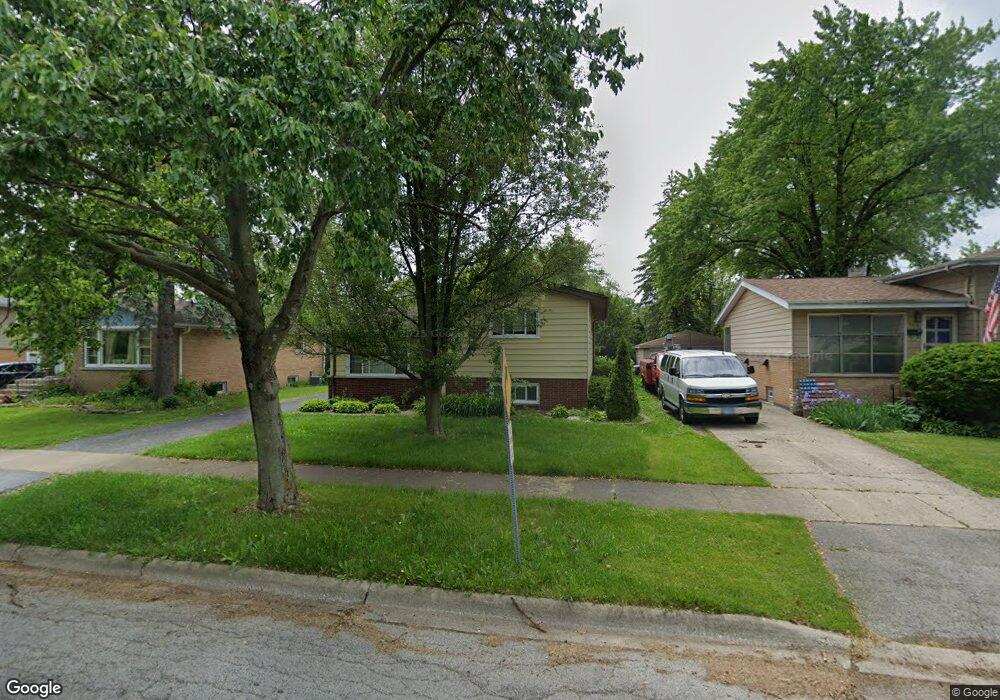
3411 218th St Matteson, IL 60443
Old Matteson NeighborhoodEstimated Value: $177,000 - $221,000
4
Beds
2
Baths
1,106
Sq Ft
$180/Sq Ft
Est. Value
About This Home
This home is located at 3411 218th St, Matteson, IL 60443 and is currently estimated at $199,524, approximately $180 per square foot. 3411 218th St is a home located in Cook County with nearby schools including Illinois School, Matteson Elementary School, and Sauk Elementary School.
Ownership History
Date
Name
Owned For
Owner Type
Purchase Details
Closed on
Feb 27, 2017
Sold by
Hubbard Prescious
Bought by
Allen Frederick
Current Estimated Value
Purchase Details
Closed on
Apr 20, 2006
Sold by
Motley Sean L
Bought by
Allen Frederick and Hubbard Precious
Home Financials for this Owner
Home Financials are based on the most recent Mortgage that was taken out on this home.
Original Mortgage
$124,400
Interest Rate
6.54%
Mortgage Type
Fannie Mae Freddie Mac
Purchase Details
Closed on
Apr 9, 2003
Sold by
Deitch Michael E
Bought by
Motley Sean L
Home Financials for this Owner
Home Financials are based on the most recent Mortgage that was taken out on this home.
Original Mortgage
$120,115
Interest Rate
5.88%
Mortgage Type
FHA
Create a Home Valuation Report for This Property
The Home Valuation Report is an in-depth analysis detailing your home's value as well as a comparison with similar homes in the area
Home Values in the Area
Average Home Value in this Area
Purchase History
| Date | Buyer | Sale Price | Title Company |
|---|---|---|---|
| Allen Frederick | -- | Ticor Title Insurance Compan | |
| Allen Frederick | $155,500 | Regency Title Services Inc | |
| Motley Sean L | $122,000 | Ticor | |
| Motley Sean L | $122,000 | Ticor |
Source: Public Records
Mortgage History
| Date | Status | Borrower | Loan Amount |
|---|---|---|---|
| Previous Owner | Allen Frederick | $124,400 | |
| Previous Owner | Motley Sean L | $120,115 |
Source: Public Records
Tax History Compared to Growth
Tax History
| Year | Tax Paid | Tax Assessment Tax Assessment Total Assessment is a certain percentage of the fair market value that is determined by local assessors to be the total taxable value of land and additions on the property. | Land | Improvement |
|---|---|---|---|---|
| 2024 | $5,242 | $14,892 | $3,002 | $11,890 |
| 2023 | $3,736 | $16,000 | $3,002 | $12,998 |
| 2022 | $3,736 | $10,308 | $2,627 | $7,681 |
| 2021 | $3,837 | $10,307 | $2,627 | $7,680 |
| 2020 | $3,670 | $10,307 | $2,627 | $7,680 |
| 2019 | $4,192 | $11,528 | $2,439 | $9,089 |
| 2018 | $4,188 | $11,528 | $2,439 | $9,089 |
| 2017 | $4,050 | $11,528 | $2,439 | $9,089 |
| 2016 | $3,906 | $10,440 | $2,251 | $8,189 |
| 2015 | $3,810 | $10,440 | $2,251 | $8,189 |
| 2014 | $3,717 | $10,440 | $2,251 | $8,189 |
| 2013 | $4,117 | $12,167 | $2,251 | $9,916 |
Source: Public Records
Map
Nearby Homes
- 338 Waldmann Dr
- 356 Winnebago St
- 21635 Dogwood Rd Unit 1165
- 183 Washington St
- 109 Walnut St
- 116 Walnut St
- 182 Washington St
- 21607 Main St
- 3704 Linden Rd
- 505 Wildwood Dr
- 119 Willow St
- 136 Willow St
- 354 Winona St
- 3133 Heritage Blvd
- 191 Westwood Dr
- 206 Westwood Dr
- 216 Washington St
- 4083 Appleby Ct
- 3704 215th St Unit 205
- 129 Warwick St