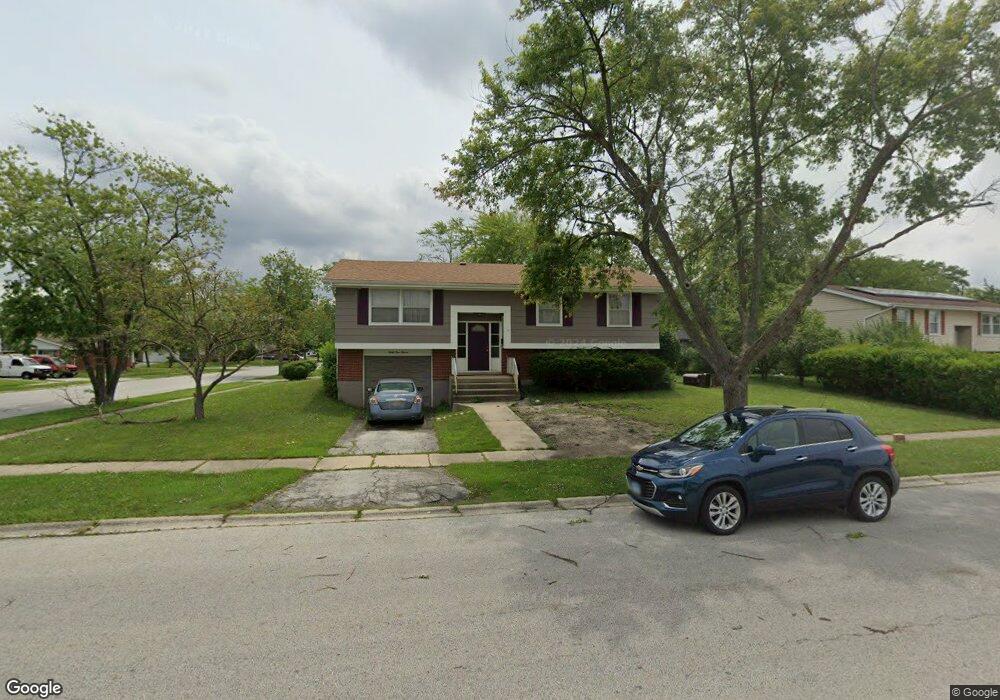
3411 Laurel Ln Hazel Crest, IL 60429
Estimated Value: $208,000 - $253,000
2
Beds
1
Bath
1,734
Sq Ft
$132/Sq Ft
Est. Value
About This Home
This home is located at 3411 Laurel Ln, Hazel Crest, IL 60429 and is currently estimated at $229,254, approximately $132 per square foot. 3411 Laurel Ln is a home located in Cook County with nearby schools including Highlands Elementary School, Prairie-Hills Junior High School, and Hillcrest High School.
Ownership History
Date
Name
Owned For
Owner Type
Purchase Details
Closed on
Dec 23, 2004
Sold by
Butler Frank P
Bought by
James Demetria R
Current Estimated Value
Home Financials for this Owner
Home Financials are based on the most recent Mortgage that was taken out on this home.
Original Mortgage
$129,200
Outstanding Balance
$74,149
Interest Rate
7.99%
Mortgage Type
New Conventional
Estimated Equity
$155,105
Purchase Details
Closed on
Apr 22, 1998
Sold by
Knox Joseph and Knox Miriam F
Bought by
James Demetria R
Home Financials for this Owner
Home Financials are based on the most recent Mortgage that was taken out on this home.
Original Mortgage
$98,911
Interest Rate
7.18%
Mortgage Type
FHA
Purchase Details
Closed on
Jul 22, 1997
Sold by
Hud
Bought by
Knox Joseph
Home Financials for this Owner
Home Financials are based on the most recent Mortgage that was taken out on this home.
Original Mortgage
$59,150
Interest Rate
7.12%
Purchase Details
Closed on
Sep 18, 1996
Sold by
Davis Leo E
Bought by
Hud
Create a Home Valuation Report for This Property
The Home Valuation Report is an in-depth analysis detailing your home's value as well as a comparison with similar homes in the area
Home Values in the Area
Average Home Value in this Area
Purchase History
| Date | Buyer | Sale Price | Title Company |
|---|---|---|---|
| James Demetria R | -- | Tca | |
| James Demetria R | $99,500 | -- | |
| Knox Joseph | -- | -- | |
| Hud | -- | -- |
Source: Public Records
Mortgage History
| Date | Status | Borrower | Loan Amount |
|---|---|---|---|
| Open | James Demetria R | $129,200 | |
| Closed | James Demetria R | $98,911 | |
| Previous Owner | Knox Joseph | $59,150 |
Source: Public Records
Tax History Compared to Growth
Tax History
| Year | Tax Paid | Tax Assessment Tax Assessment Total Assessment is a certain percentage of the fair market value that is determined by local assessors to be the total taxable value of land and additions on the property. | Land | Improvement |
|---|---|---|---|---|
| 2024 | $4,627 | $15,001 | $2,828 | $12,173 |
| 2023 | $1,941 | $15,001 | $2,828 | $12,173 |
| 2022 | $1,941 | $9,487 | $2,393 | $7,094 |
| 2021 | $1,998 | $9,485 | $2,392 | $7,093 |
| 2020 | $1,902 | $9,485 | $2,392 | $7,093 |
| 2019 | $2,107 | $10,006 | $2,175 | $7,831 |
| 2018 | $4,263 | $10,006 | $2,175 | $7,831 |
| 2017 | $4,020 | $10,006 | $2,175 | $7,831 |
| 2016 | $3,618 | $8,686 | $1,957 | $6,729 |
| 2015 | $3,396 | $8,686 | $1,957 | $6,729 |
| 2014 | $3,342 | $8,686 | $1,957 | $6,729 |
| 2013 | $3,141 | $9,189 | $1,957 | $7,232 |
Source: Public Records
Map
Nearby Homes
- 17113 Elm Dr
- 3324 Laurel Ln
- 3500 Maple Ln
- 3312 Maple Ln
- 17007 Elm Dr
- 3317 Woodworth Place
- 17206 Elm Dr
- 17004 Locust Dr
- 3425 Birchwood Dr
- 3509 Birchwood Dr
- 3205 Oak Ct
- 3512 Woodworth Place
- 3316 Birchwood Dr
- 3214 Birchwood Dr
- 3213 Woodworth Place
- 17306 Burr Oak Ln
- 17311 Burr Oak Ln
- 17316 Central Park Ave
- 3618 Peach Grove Ln
- 3124 173rd St