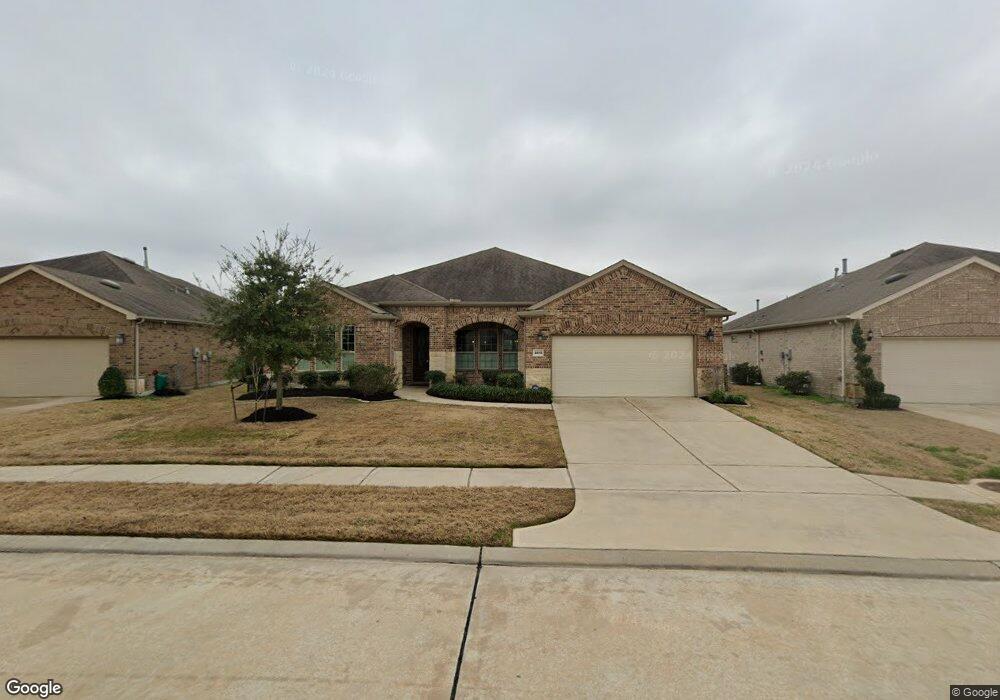
3411 Sapelo Way Richmond, TX 77469
Estimated Value: $464,000 - $495,000
2
Beds
3
Baths
2,823
Sq Ft
$171/Sq Ft
Est. Value
About This Home
This home is located at 3411 Sapelo Way, Richmond, TX 77469 and is currently estimated at $482,335, approximately $170 per square foot. 3411 Sapelo Way is a home with nearby schools including J J Wessendorff Middle School, Lamar Junior High School, and Lamar Consolidated High School.
Ownership History
Date
Name
Owned For
Owner Type
Purchase Details
Closed on
Aug 10, 2020
Sold by
Mcgrory Bruce E and Mcgrory Virginia W
Bought by
Mcgrory Bruce E
Current Estimated Value
Home Financials for this Owner
Home Financials are based on the most recent Mortgage that was taken out on this home.
Original Mortgage
$398,010
Outstanding Balance
$352,404
Interest Rate
2.9%
Mortgage Type
VA
Estimated Equity
$129,931
Purchase Details
Closed on
Dec 5, 2017
Sold by
Pulte Homes Of Texas Lp
Bought by
Megrory Bruce E and Megrory Virginia W
Home Financials for this Owner
Home Financials are based on the most recent Mortgage that was taken out on this home.
Original Mortgage
$405,996
Interest Rate
3.94%
Mortgage Type
VA
Purchase Details
Closed on
Apr 29, 2015
Sold by
Cw Richmond Lp
Bought by
Pulte Homes Of Texas Lp
Purchase Details
Closed on
Oct 7, 2014
Sold by
Cw Richmond Lp
Bought by
Pulte Homes Of Texas Lp
Create a Home Valuation Report for This Property
The Home Valuation Report is an in-depth analysis detailing your home's value as well as a comparison with similar homes in the area
Home Values in the Area
Average Home Value in this Area
Purchase History
| Date | Buyer | Sale Price | Title Company |
|---|---|---|---|
| Mcgrory Bruce E | -- | Servicelink | |
| Megrory Bruce E | -- | None Available | |
| Pulte Homes Of Texas Lp | -- | -- | |
| Pulte Homes Of Texas Lp | -- | -- |
Source: Public Records
Mortgage History
| Date | Status | Borrower | Loan Amount |
|---|---|---|---|
| Open | Mcgrory Bruce E | $398,010 | |
| Closed | Megrory Bruce E | $405,996 |
Source: Public Records
Tax History Compared to Growth
Tax History
| Year | Tax Paid | Tax Assessment Tax Assessment Total Assessment is a certain percentage of the fair market value that is determined by local assessors to be the total taxable value of land and additions on the property. | Land | Improvement |
|---|---|---|---|---|
| 2025 | $7,266 | $519,085 | $68,250 | $450,835 |
| 2024 | $7,266 | $517,384 | $39,195 | $478,189 |
| 2023 | $7,400 | $470,349 | $0 | $470,688 |
| 2022 | $9,738 | $427,590 | $34,330 | $393,260 |
| 2021 | $11,486 | $388,720 | $52,500 | $336,220 |
| 2020 | $11,673 | $384,320 | $52,500 | $331,820 |
| 2019 | $12,012 | $371,440 | $52,500 | $318,940 |
| 2018 | $12,873 | $393,770 | $52,500 | $341,270 |
| 2017 | $1,153 | $35,000 | $35,000 | $0 |
| 2016 | $1,153 | $35,000 | $35,000 | $0 |
| 2015 | $657 | $35,000 | $35,000 | $0 |
Source: Public Records
Map
Nearby Homes
- 502 Sapelo Ct
- 3407 Sapelo Way
- 442 Spindrift Cir
- 3403 Satin Leaf Ln
- 3423 Sandhill Crane Way
- 3210 Cocoplum Way
- 638 Saffron Plum Ln
- 3507 Satin Leaf Ln
- 3422 King Eider Ct
- 3414 King Eider Ct
- 606 Saguaro Way
- 3503 Anchor Cove
- 3251 Chimney Swift Ln
- 3727 Paper Birch Dr
- 3723 Paper Birch Dr
- 3218 Chimney Swift Ln
- 343 Crested Eagle Dr
- 3814 County Seat Ln
- 3810 County Seat Ln
- 4010 Swallow Tail Way
- 3415 Sapelo Way
- 3419 Sapelo Way
- 3403 Sapelo Way
- 415 Spindrift Cir
- 3423 Sapelo Way
- 3310 Dandelion Dr
- 406 Spindrift Cir
- 419 Spindrift Cir
- 410 Spindrift Cir
- 506 Sapelo Ct
- 3306 Dandelion Dr
- 3427 Sapelo Way
- 3402 Satin Leaf Ln
- 3227 Canella Cove
- 402 Spindrift Cir
- 3302 Dandelion Dr
- 418 Spindrift Cir
- 3223 Canella Cove
- 427 Spindrift Cir
- 414 Spindrift Cir