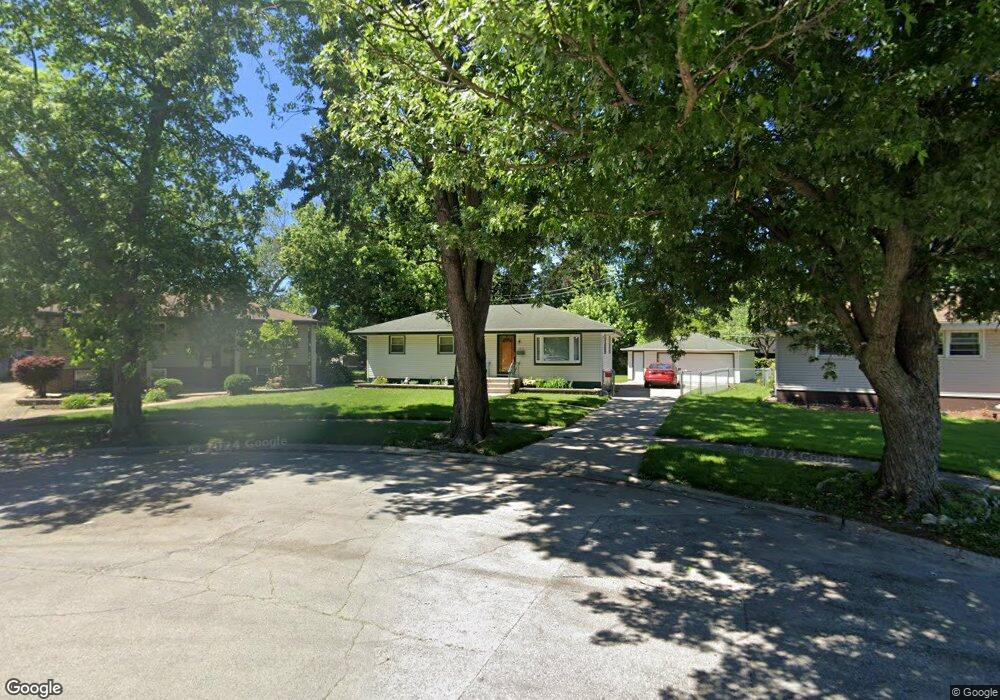
3412 E 170th St Lansing, IL 60438
Estimated Value: $182,000 - $227,000
3
Beds
2
Baths
1,008
Sq Ft
$196/Sq Ft
Est. Value
About This Home
This home is located at 3412 E 170th St, Lansing, IL 60438 and is currently estimated at $197,778, approximately $196 per square foot. 3412 E 170th St is a home located in Cook County with nearby schools including Reavis Elementary School, Memorial Jr High School, and Thornton Fractnl So High School.
Ownership History
Date
Name
Owned For
Owner Type
Purchase Details
Closed on
Aug 11, 2023
Sold by
Mazzorana Dennis A and Mazzorana Gloria Ann
Bought by
Alfano John J
Current Estimated Value
Home Financials for this Owner
Home Financials are based on the most recent Mortgage that was taken out on this home.
Original Mortgage
$155,200
Outstanding Balance
$150,773
Interest Rate
6.25%
Mortgage Type
New Conventional
Estimated Equity
$47,005
Purchase Details
Closed on
Mar 9, 2001
Sold by
Mazzorana Joseph C
Bought by
Mazzorana Dennis A
Purchase Details
Closed on
May 4, 1998
Sold by
Williams Kenneth C and Williams Vicki S
Bought by
Mazzorana Dennis A and Mazzorana Joseph C
Home Financials for this Owner
Home Financials are based on the most recent Mortgage that was taken out on this home.
Original Mortgage
$98,800
Interest Rate
7.27%
Create a Home Valuation Report for This Property
The Home Valuation Report is an in-depth analysis detailing your home's value as well as a comparison with similar homes in the area
Home Values in the Area
Average Home Value in this Area
Purchase History
| Date | Buyer | Sale Price | Title Company |
|---|---|---|---|
| Alfano John J | $160,000 | None Listed On Document | |
| Mazzorana Dennis A | -- | -- | |
| Mazzorana Dennis A | $104,000 | -- |
Source: Public Records
Mortgage History
| Date | Status | Borrower | Loan Amount |
|---|---|---|---|
| Open | Alfano John J | $155,200 | |
| Previous Owner | Mazzorana Dennis A | $98,800 |
Source: Public Records
Tax History
| Year | Tax Paid | Tax Assessment Tax Assessment Total Assessment is a certain percentage of the fair market value that is determined by local assessors to be the total taxable value of land and additions on the property. | Land | Improvement |
|---|---|---|---|---|
| 2025 | $5,654 | $15,000 | $3,832 | $11,168 |
| 2024 | $5,654 | $15,000 | $3,832 | $11,168 |
| 2023 | $4,300 | $15,000 | $3,832 | $11,168 |
| 2022 | $4,300 | $10,037 | $3,353 | $6,684 |
| 2021 | $4,240 | $10,037 | $3,353 | $6,684 |
| 2020 | $4,068 | $10,037 | $3,353 | $6,684 |
| 2019 | $4,025 | $10,500 | $3,113 | $7,387 |
| 2018 | $3,947 | $10,500 | $3,113 | $7,387 |
| 2017 | $4,020 | $10,500 | $3,113 | $7,387 |
| 2016 | $4,116 | $10,025 | $2,874 | $7,151 |
| 2015 | $3,761 | $10,025 | $2,874 | $7,151 |
| 2014 | $3,736 | $10,025 | $2,874 | $7,151 |
| 2013 | $3,719 | $10,888 | $2,874 | $8,014 |
Source: Public Records
Map
Nearby Homes
- 3351 171st St
- 3312 E 170th St
- 395 166th St
- 1531 Lincoln Ave
- 1517 Freeland Ave
- 1568 Wentworth Ave
- 17204 Bernadine St
- 17153 Walter St
- 17132 Walter St
- 1494 Stanley Blvd
- 17056 Burnham Ave
- 17226 Community St
- 1593 Kenilworth Dr
- 1581 Kenilworth Dr
- 1527 Wentworth Ave
- 1501 Forest Ave
- 1554 Burnham Ave
- 1481 Lincoln Ave
- 1469 Stanley Blvd
- 1475 Lincoln Ave
- 17010 Grant St
- 3418 E 170th St
- 17020 Grant St
- 3426 E 170th St
- 3409 169th Ct
- 3415 169th Ct
- 17001 Henry St
- 17030 Grant St
- 3403 169th Ct
- 3421 169th Ct
- 3421 169th Ct
- 3419 E 170th St
- 3428 E 170th St
- 17009 Henry St
- 3354 E 170th St
- 17019 Henry St
- 17040 Grant St
- 3427 169th Ct
- 3434 E 170th St
- 3427 E 170th St
Your Personal Tour Guide
Ask me questions while you tour the home.