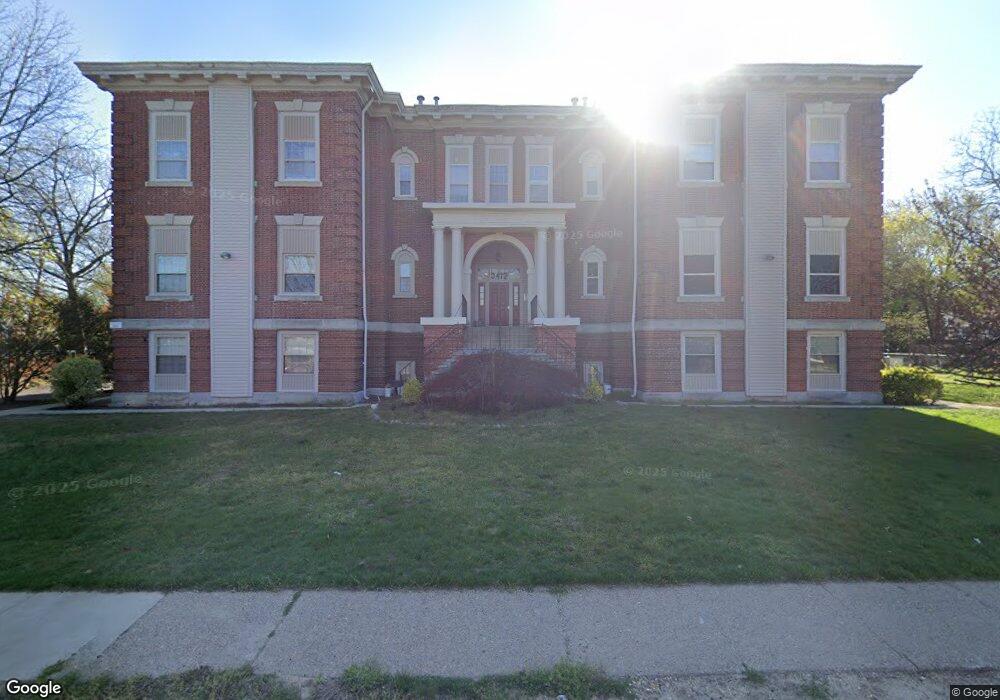
3412 Union Ave Unit A6 Pennsauken, NJ 08109
Estimated Value: $173,000
--
Bed
--
Bath
994
Sq Ft
$174/Sq Ft
Est. Value
About This Home
This home is located at 3412 Union Ave Unit A6, Pennsauken, NJ 08109 and is currently estimated at $173,000, approximately $174 per square foot. 3412 Union Ave Unit A6 is a home located in Camden County with nearby schools including Pennsauken High School and St. Peter Elementary School.
Ownership History
Date
Name
Owned For
Owner Type
Purchase Details
Closed on
May 2, 2024
Sold by
Bw Premier Homes Llc
Bought by
Herrera Thomas
Current Estimated Value
Home Financials for this Owner
Home Financials are based on the most recent Mortgage that was taken out on this home.
Original Mortgage
$148,500
Outstanding Balance
$146,256
Interest Rate
6.82%
Mortgage Type
New Conventional
Estimated Equity
$26,744
Purchase Details
Closed on
Jan 3, 2024
Sold by
Sheriff / The County / Camden
Bought by
Pedano Francis R and Schoolhouse Commons At Union Avenue Condomini
Purchase Details
Closed on
Jul 12, 2021
Sold by
Granroth Joe and Granroth Joseph
Bought by
Pedano Francis R
Home Financials for this Owner
Home Financials are based on the most recent Mortgage that was taken out on this home.
Original Mortgage
$92,150
Interest Rate
2.9%
Mortgage Type
New Conventional
Purchase Details
Closed on
Apr 14, 2014
Sold by
Fannie Mae
Bought by
Granroth Joe
Purchase Details
Closed on
Mar 16, 2013
Sold by
Zubak Benjamin J and Zubak Teresa
Bought by
Federal National Mortgage Association
Purchase Details
Closed on
Jun 20, 2007
Sold by
Garbett David A
Bought by
Zubak Benjamin J
Home Financials for this Owner
Home Financials are based on the most recent Mortgage that was taken out on this home.
Original Mortgage
$124,900
Interest Rate
6.39%
Mortgage Type
New Conventional
Purchase Details
Closed on
Dec 5, 2003
Sold by
Murphy Marjorie L
Bought by
Garbett David A
Home Financials for this Owner
Home Financials are based on the most recent Mortgage that was taken out on this home.
Original Mortgage
$64,600
Interest Rate
5.89%
Create a Home Valuation Report for This Property
The Home Valuation Report is an in-depth analysis detailing your home's value as well as a comparison with similar homes in the area
Home Values in the Area
Average Home Value in this Area
Purchase History
| Date | Buyer | Sale Price | Title Company |
|---|---|---|---|
| Herrera Thomas | $165,000 | Weichert Title Group | |
| Herrera Thomas | $165,000 | Weichert Title Group | |
| Pedano Francis R | $91,000 | None Listed On Document | |
| Pedano Francis R | $91,000 | None Listed On Document | |
| Pedano Francis R | $95,000 | Surety Title Company | |
| Granroth Joe | $39,000 | None Available | |
| Federal National Mortgage Association | -- | Land Title Services Of New | |
| Zubak Benjamin J | $124,900 | -- | |
| Garbett David A | $71,000 | -- |
Source: Public Records
Mortgage History
| Date | Status | Borrower | Loan Amount |
|---|---|---|---|
| Open | Herrera Thomas | $148,500 | |
| Closed | Herrera Thomas | $148,500 | |
| Previous Owner | Pedano Francis R | $92,150 | |
| Previous Owner | Zubak Benjamin J | $124,900 | |
| Previous Owner | Garbett David A | $64,600 |
Source: Public Records
Tax History Compared to Growth
Tax History
| Year | Tax Paid | Tax Assessment Tax Assessment Total Assessment is a certain percentage of the fair market value that is determined by local assessors to be the total taxable value of land and additions on the property. | Land | Improvement |
|---|---|---|---|---|
| 2025 | $3,677 | $161,000 | $40,000 | $121,000 |
| 2024 | $3,606 | $84,500 | $15,000 | $69,500 |
| 2023 | $3,606 | $84,500 | $15,000 | $69,500 |
| 2022 | $3,261 | $84,500 | $15,000 | $69,500 |
| 2021 | $3,151 | $84,500 | $15,000 | $69,500 |
| 2020 | $3,000 | $84,500 | $15,000 | $69,500 |
| 2019 | $3,034 | $84,500 | $15,000 | $69,500 |
| 2018 | $3,050 | $84,500 | $15,000 | $69,500 |
| 2017 | $3,056 | $84,500 | $15,000 | $69,500 |
| 2016 | $3,001 | $84,500 | $15,000 | $69,500 |
| 2015 | $3,091 | $84,500 | $15,000 | $69,500 |
| 2014 | $3,048 | $54,800 | $10,400 | $44,400 |
Source: Public Records
Map
Nearby Homes
- 3412 Union Ave Unit C4
- 7775 Marion Ave
- 7430 Walnut Ave
- 7812 Marion Ave
- 7263 Cedar Ave
- 3002 Gladwyn Ave
- 7750 Hesson Ln
- 3215 Cooper Ave
- 4312 Union Ave
- 7418 Harvey Ave
- 7218 Irving Ave
- 7336 Rudderow Ave
- 7665 Rudderow Ave
- 7628 Rudderow Ave
- 6936 Cedar Ave
- 7340 Maple Ave
- 2657 Rockafellow Ave
- 8331 Stockton Ave
- 7330 Maple Ave Unit 123
- 7320 Maple Ave Unit 231
- 3412 Union Ave Unit C2
- 3412 Union Ave Unit B2
- 3412 Union Ave Unit C5
- 3412 Union Ave Unit A5
- 3412 Union Ave Unit A4
- 3412 Union Ave Unit A3
- 3412 Union Ave Unit A1
- 3412 Union Ave Unit C3
- 3412 Union Ave Unit C1
- 3412 Union Ave Unit B4
- 3412 Union Ave Unit A2
- 3412 Union Ave Unit B1
- 3412 Union Ave Unit B3
- 3412 Union Ave
- 3440 Union Ave
- 7706 Park Ave
- 3450 Union Ave
- 7550 Park Ave
- 7562 Park Ave Unit 64
- 7708 Park Ave