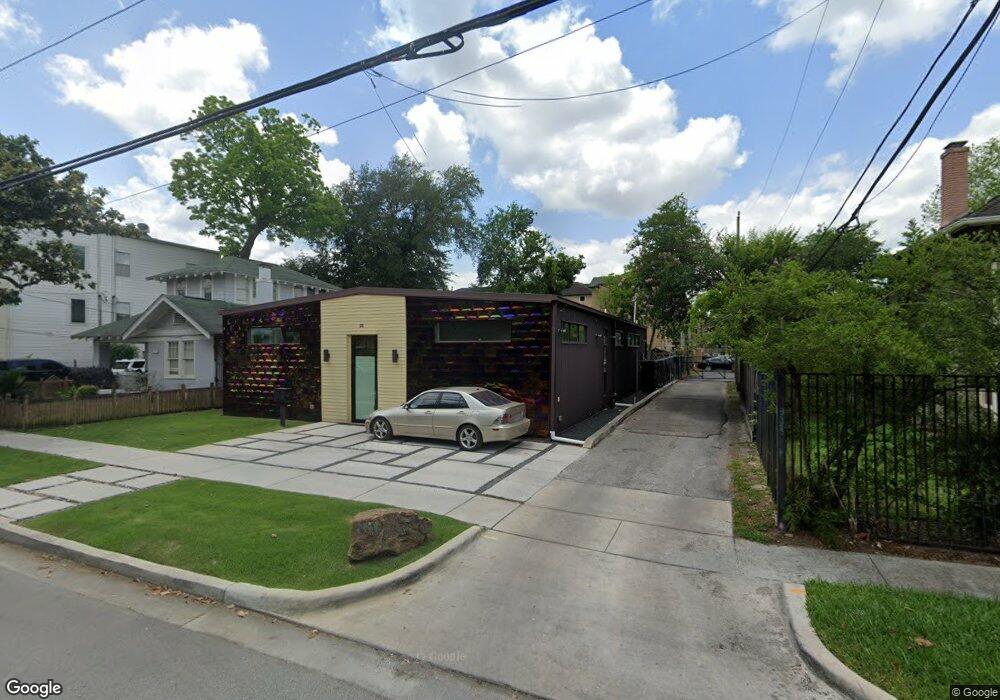
3412 Yupon St Houston, TX 77006
Montrose NeighborhoodEstimated Value: $891,000 - $922,088
2
Beds
2
Baths
2,400
Sq Ft
$377/Sq Ft
Est. Value
About This Home
This home is located at 3412 Yupon St, Houston, TX 77006 and is currently estimated at $905,522, approximately $377 per square foot. 3412 Yupon St is a home located in Harris County with nearby schools including Baker Montessori, Lanier Middle School, and Lamar High School.
Ownership History
Date
Name
Owned For
Owner Type
Purchase Details
Closed on
Dec 30, 2015
Sold by
Yupon Interests Llc
Bought by
Pow Sang Dennis
Current Estimated Value
Home Financials for this Owner
Home Financials are based on the most recent Mortgage that was taken out on this home.
Original Mortgage
$360,000
Interest Rate
3.98%
Mortgage Type
Purchase Money Mortgage
Purchase Details
Closed on
Aug 29, 2013
Sold by
Woodhead Interests Llc
Bought by
Yupon Interests Llc
Purchase Details
Closed on
Feb 24, 2009
Sold by
Kass Malka and Kass Morris
Bought by
Woodhead Interests Llc
Purchase Details
Closed on
Jun 30, 2008
Sold by
Esses Associates
Bought by
Kass Malka and Kass Morris
Purchase Details
Closed on
Jun 6, 1995
Sold by
Jacobe Marjorie Dunn and Bautsch Harold L
Bought by
Esses Max F and Esses Eli
Create a Home Valuation Report for This Property
The Home Valuation Report is an in-depth analysis detailing your home's value as well as a comparison with similar homes in the area
Home Values in the Area
Average Home Value in this Area
Purchase History
| Date | Buyer | Sale Price | Title Company |
|---|---|---|---|
| Pow Sang Dennis | -- | Capital Title | |
| Yupon Interests Llc | -- | Title Houston Holdings Ltd | |
| Woodhead Interests Llc | -- | None Available | |
| Kass Malka | -- | None Available | |
| Esses Max F | -- | Commonwealth Land Title Co |
Source: Public Records
Mortgage History
| Date | Status | Borrower | Loan Amount |
|---|---|---|---|
| Closed | Pow Sang Dennis | $360,000 |
Source: Public Records
Tax History Compared to Growth
Tax History
| Year | Tax Paid | Tax Assessment Tax Assessment Total Assessment is a certain percentage of the fair market value that is determined by local assessors to be the total taxable value of land and additions on the property. | Land | Improvement |
|---|---|---|---|---|
| 2025 | $12,071 | $1,066,657 | $756,000 | $310,657 |
| 2024 | $12,071 | $976,047 | $693,000 | $283,047 |
| 2023 | $12,071 | $1,017,749 | $693,000 | $324,749 |
| 2022 | $14,043 | $884,694 | $504,000 | $380,694 |
| 2021 | $13,513 | $693,680 | $488,880 | $204,800 |
| 2020 | $12,764 | $822,061 | $476,900 | $345,161 |
| 2019 | $12,125 | $545,257 | $466,860 | $78,397 |
| 2018 | $8,560 | $542,581 | $470,625 | $71,956 |
| 2017 | $10,508 | $718,748 | $470,625 | $248,123 |
| 2016 | $9,553 | $360,000 | $359,900 | $100 |
| 2015 | $199 | $355,924 | $187,200 | $168,724 |
| 2014 | $199 | $165,848 | $140,400 | $25,448 |
Source: Public Records
Map
Nearby Homes
- 3403 Yupon St
- 3311 Yupon St Unit 611
- 3311 Yupon St Unit 519
- 1621 California St
- 3515 Yupon St
- 3540 Yupon St
- 1503 Harold St
- 1101 Hawthorne St
- 1540 Hawthorne St Unit 4
- 1539 Westheimer Rd
- 1621 Cherryhurst St
- 1507 Kipling St
- 1511 Kipling St
- 1517 Kipling St
- 1510 Marshall St
- 2516 Commonwealth St Unit 102
- 1515 Hyde Park Blvd Unit 1
- 1621 Haver St
- 1709 Haver St
- 1620 Harold St
- 3414 Yupon St
- 3410 Yupon St
- 3420 Yupon St
- 1402 Harold St
- 3404 Yupon St
- 1400 Harold St
- 1412A Harold St
- 1412D Harold St
- 3411 Yupon St Unit 602
- 3411 Yupon St Unit 519
- 3411 Yupon St Unit 619
- 3411 Yupon St Unit 516
- 3407 Yupon St
- 1410 Harold St
- 3417 Yupon St
- 3405 Yupon St
- 3405 Yupon St
- 3405 Yupon St Unit A
- 1407 Hawthorne St
- 1312 Harold St Unit 4